

The scene repeats in subscription teams every month. The growth lead opens Mixpanel, finance opens Stripe and App Store Connect, the product manager opens RevenueCat — and three screens report three different numbers for what everyone assumed was the same metric. Active subscribers. Conversions. Revenue for the period. The review slows, then stalls, then quietly becomes an argument about whose dashboard is telling the truth.
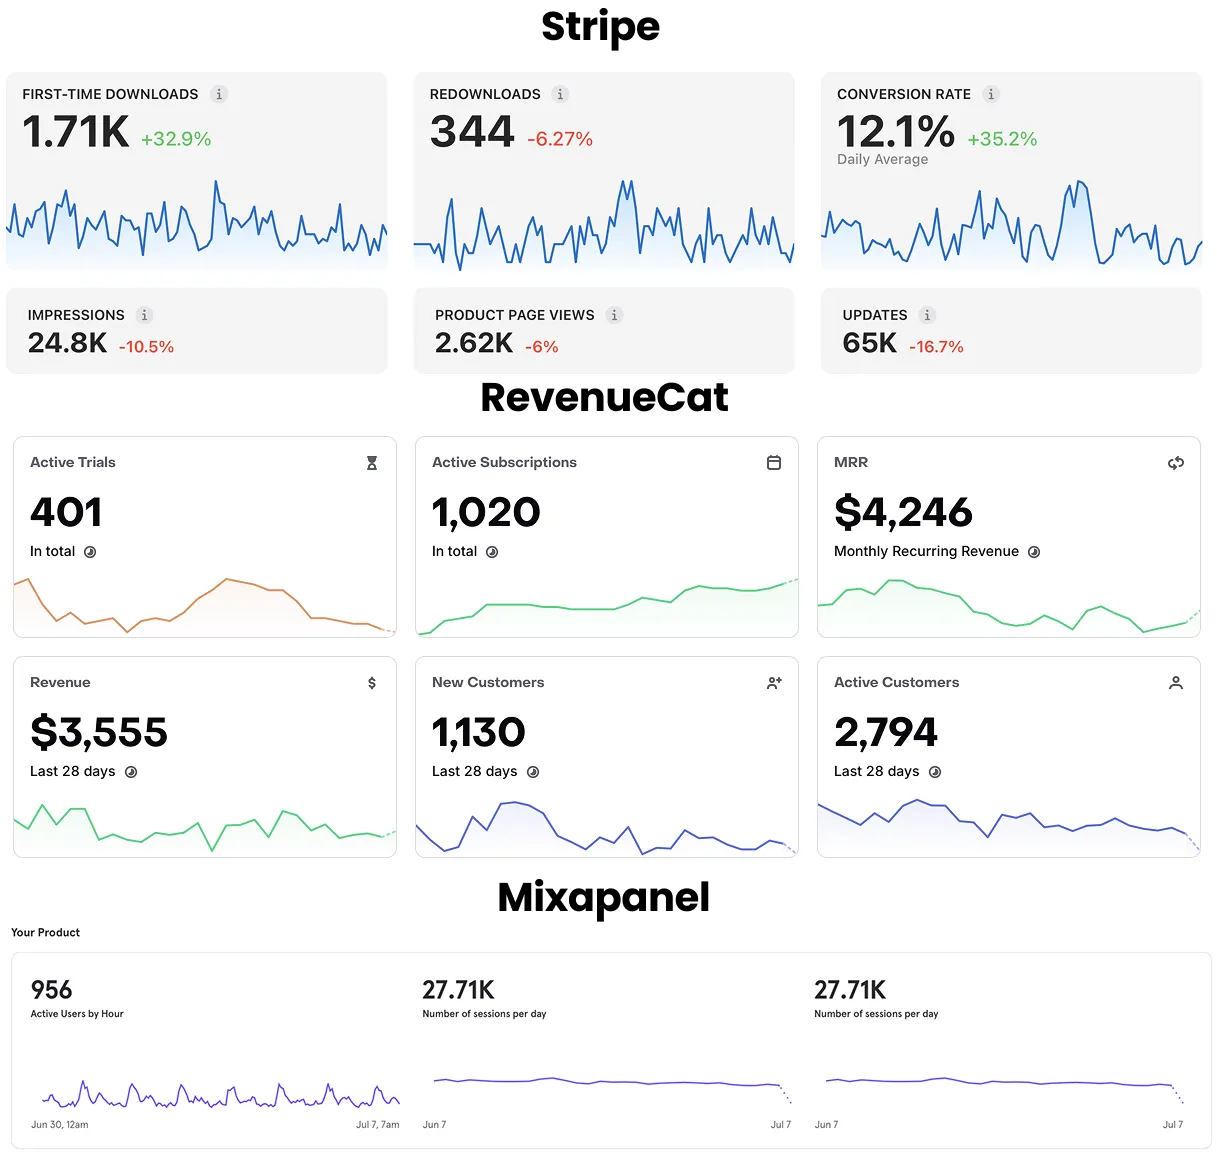
Most teams treat that gap as a defect — something to chase until the numbers line up. They rarely do. The more useful starting point, and the one senior operators eventually reach, is that these systems were never built to agree. They measure different events, at different moments, under different definitions of the same word. When Mixpanel, RevenueCat, and Stripe show different numbers, that is not a sign your tracking is broken — it is the expected output of three tools doing three different jobs.
This piece explains why the disagreement is structural, where the specific gaps come from, and — more importantly — how to reconcile them. The goal is not one number everyone agrees on. It is knowing which system is authoritative for which question, and treating the deltas between them as information rather than error.
Why do your analytics tools show different numbers?
Because each one is built to measure something different. The mismatch is not a configuration mistake you can settle once and forget; as the team at Airbridge has argued, systems like these were never designed to reconcile, because billing platforms, measurement tools, and ad platforms each record their own events on their own clocks. The same logic applies inside your own stack, across the three systems most subscription teams run at once.
The cleanest way to hold this is as three lenses, each pointed at a different layer of the same business.
What each system is actually built to measure
Mixpanel measures behaviour. It records what users do — screens viewed, buttons tapped, funnels entered and abandoned — largely through client-side events. It is the lens for why something happened in the product, and it is the least authoritative on money.
RevenueCat measures the subscription lifecycle. It tracks entitlements, trial starts, conversions, renewals, and churn. Critically, it only knows what reaches it: RevenueCat collects data through its own software development kit (SDK) and REST application programming interface (API), with no direct connection to App Store Connect or Google Play reports. It is the lens for subscription state.
Stripe and the app stores measure money. This is where actual payments settle, refunds clear, and revenue is recognised. Stripe records every transaction — including refunds and disputes — and recognises revenue on an accrual basis, which the Stripe documentation notes can land earlier or later than when cash actually arrives. It is the lens for recognised revenue, and the one finance trusts.
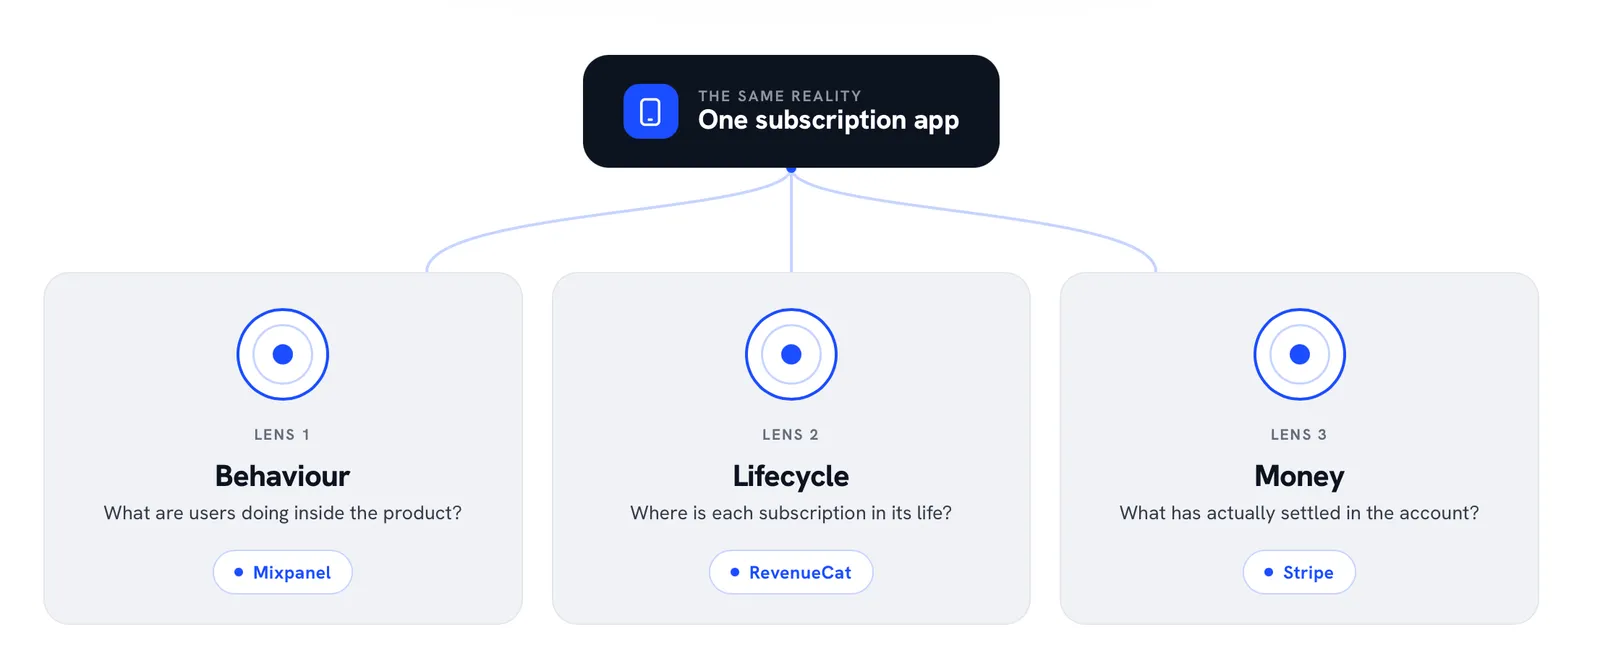
Three lenses, three jobs. The reason your subscription analytics stack reports three different figures is that you are looking at behaviour, state, and money — and asking each to answer for the others.
The 4 structural mismatches behind the spread
Once you accept that the systems measure different things, the next question is where the gaps actually open. There are 4 structural sources, and almost every discrepancy you will ever investigate traces back to one of them.
Timing — every system stamps a different clock
No two of these tools agree on when an event happened, or even on which calendar to count it against. Mixpanel records events in Coordinated Universal Time (UTC) at intake but displays them in US Pacific time by default, so a late-night purchase can fall on a different day depending on where you read it. RevenueCat reports on a calendar month and converts currency at the time of the transaction, while Apple's financial reports run on a fiscal calendar that does not align to month-end. Stripe distinguishes booked revenue from recognised revenue, and its figures keep moving until the accounting period closes.
On the acquisition side, the same problem compounds: a mobile measurement partner's (MMP) attribution windowsfrequently close before a free trial converts to paid, so the conversion that RevenueCat records days later may never be credited the same way upstream.
Definitions — "active", "trial", and "churned" don't mean the same thing twice
Each system encodes its own definition of words your team uses as if they were universal. "Active" in RevenueCat means a live entitlement; "active" in Mixpanel means a user who fired an event; "active" in a payout report means a payment that cleared. A trial start and a trial conversion are different events that close at different times. A subscription can be cancelled but still entitled until period end, lapsed without a refund, or refunded after it was already counted as revenue. The same is true of the metrics built on top of these definitions — even how average revenue per user (ARPU) and lifetime value (LTV) relate shifts depending on which system's events feed the calculation.
Money — proceeds, refunds, and currency never line up with gross
The money lens is the most quietly treacherous. What a customer pays is not what you keep: the app stores take a commission — 30% standard, dropping to 15% under the small business program or after a subscriber's first year — so a system reporting gross and a system reporting proceeds will diverge by a predictable but easily-forgotten margin. Proceeds are defined as price minus commission, and the exact rate depends on configuration most dashboards do not see.
Refunds widen the gap further. Apple's fees are reported implicitly and have to be derived, with no direct line connecting a subscription to the refund that later reverses it, which makes clean offsetting genuinely hard. Stripe handles the same events through contra revenue that offsets the original entry, in the period of the refund rather than the period of the sale. RevenueCat, lacking the store's per-user price, estimates price from its own data — affected by currency conversion, taxes, and price changes. Layer on foreign-exchange (FX) translation, which Stripe applies at a mid-market rate taken at billing time, and three systems will report three defensible revenue figures for one cohort.
Collection — client-side behaviour versus server-side records
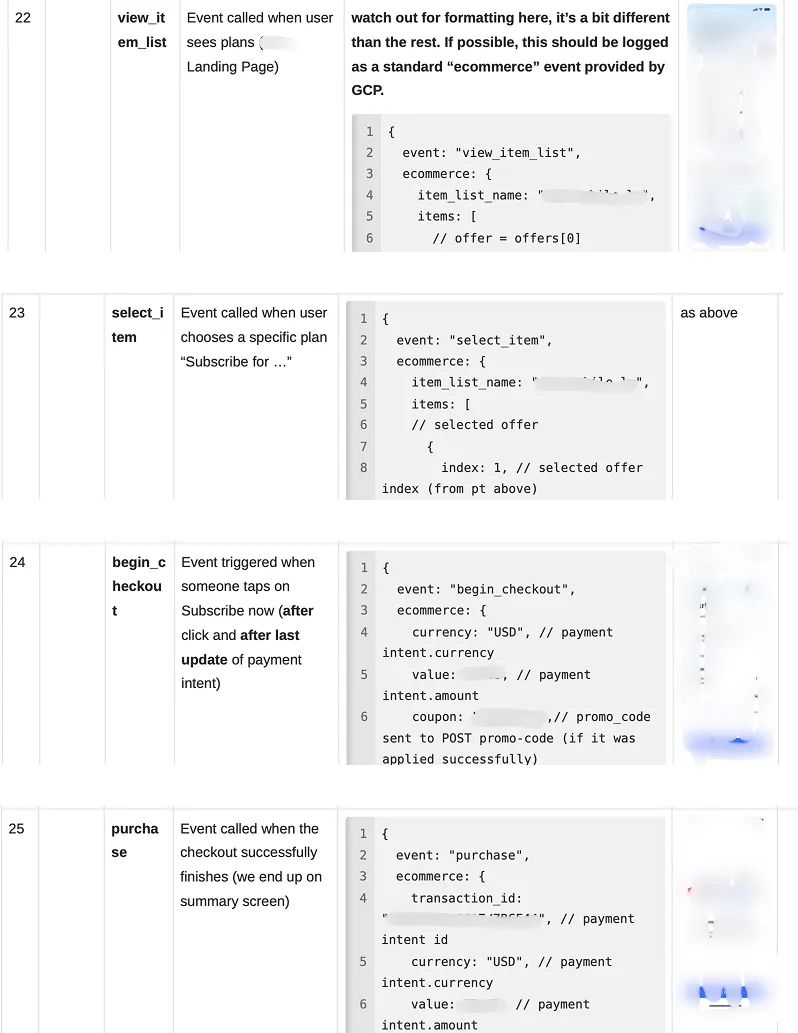
The last gap is about what reaches each system at all. Mixpanel's own documentation is direct about it: client-side tracking can lose events for 30–50% of users to ad blockers and privacy settings, and the company recommends tracking revenue-critical events server-side for exactly this reason. Billing systems see the server-side truth because payments cannot be ad-blocked. So a behavioural funnel and a billing ledger are not just measuring different things — they are working from different populations of events.
How timing, definitions, money, and collection differ across the three systems
| Mismatch | Mixpanel (behaviour) | RevenueCat (lifecycle) | Stripe / App Stores (money) |
|---|---|---|---|
| Timing | UTC intake, Pacific display | Calendar month, FX at transaction | Accrual; fiscal months; booked ≠ recognised |
| Definitions | "Active" = fired an event | "Active" = live entitlement | "Active" = payment cleared |
| Money | Not a revenue source | Estimates per-user price | Gross vs proceeds; contra-revenue refunds |
| Collection | Client-side; 30–50% loss possible | SDK / API only | Server-side; complete |
The wrong question: "Which number is right?"
Faced with the spread, most teams ask the wrong question first. They litigate which dashboard wins — and burn review cycles trying to crown a single correct figure that does not exist. The cost of that habit is rising: in a market where RevenueCat's 2026 benchmark of more than 115,000 apps shows growth concentrating sharply among the strongest operators, the teams that move fastest are the ones not stuck arguing about their own numbers.
Consider an illustrative pattern from one engagement. For a single monthly cohort, Mixpanel reported one conversion count, RevenueCat reported another, and the payment processor recorded a third — a spread in the region of 15–20%. Investigated properly, none of it came from a tracking break. It came entirely from timing and refund handling: conversions that landed after Mixpanel's client-side window, trials counted before they cleared, and refunds that reversed revenue in a later period than the sale. This is one team's experience, not a measured benchmark — the exact spread will differ for every app — but the shape of it is typical.
The reframe is the whole point of this piece. The question is not which number is right, but which number is authoritative for this decision. That distinction matters because downstream work inherits the discrepancy. An A/B test read against the wrong system can pass a validation gate it should have failed, and an LTV model built on behavioural conversions rather than cleared payments will forecast revenue that never arrives. Choosing the wrong authority does not just produce an argument in a meeting — it produces a wrong decision two quarters later.
A reconciliation framework: one source of truth per question
The fix is not consolidation onto one tool. It is assigning each system as the source of truth for the question it is structurally best at, and reconciling the deltas rather than trying to erase them.
The framework is simple to state and disciplined to hold:
- Money is the payment processor and the app stores. Recognised revenue, proceeds, refunds, and anything finance reports externally come from payout data — not from a behavioural dashboard. RevenueCat's own guidance points the same way: use the actual store payout reports for accounting, because RevenueCat does not pull those reports directly.
- Subscription state is RevenueCat. Trial starts, conversions, entitlements, renewals, churn, and cohort LTV trends come from the lifecycle system, which is purpose-built to track them.
- Behaviour is Mixpanel. The funnel, the drop-off points, the why behind a conversion rate come from the behavioural lens — the one tool that can tell you what happened inside the product, even if it under-counts the total.

Reconcile the gaps between these on purpose. A delta is not failure; it is the difference between two valid measurements, and once you know its expected size, it becomes a number you monitor rather than a number you fear.
Which tool should be your source of truth for revenue?
For recognised revenue and anything that reaches a board deck or an investor, the payment processor and app-store payout reports are authoritative — they are the record of money that actually moved and cleared. RevenueCat is authoritative for live subscription state and for cohort revenue trends over time, where its lifecycle modelling is strongest. Mixpanel should never be your revenue source of truth; it is the system that explains the behaviour behind the revenue, not the system that counts it. Use each for its job and the question answers itself.
The operating discipline that makes it stick
A framework on a slide does not survive contact with a busy month. Three operational habits keep it alive, and together they form the operating sequence we use at Applica Agency when a team's dashboards stop agreeing.
Run a reconciliation cadence. Once a month, compare the same metric across systems and check the delta against its expected variance band. You are not looking for zero difference — you are confirming the difference is the size it always is. Comparing well means comparing the same point in the journey, over the same time frame, with the same units, or the exercise produces noise. Time it deliberately, too: ledgers settle on a lag, and reconciling before a payment system's entries have finalised manufactures deltas that resolve themselves a day later.
Keep a definitions ledger. Document, in one place, exactly what each system means by every shared word — "active", "trial", "conversion", "churn", "revenue". When a new analyst asks why two dashboards disagree, the ledger answers before the meeting starts.
Own a "which number do we quote" policy. For each headline metric, name one authoritative system and one owner. When revenue appears in a deck, everyone knows it came from payouts; when conversion rate appears in a product review, everyone knows it came from RevenueCat. The same discipline underpins the growth metrics worth tracking in the first place — a metric without an agreed source is a metric without a meaning.
When the disagreement is actually a problem
None of this means every discrepancy is benign. The framework works precisely because it tells you what normal looks like — and that is what lets you spot the abnormal.
When a delta drifts beyond its historical band, that is the signal worth acting on. A behavioural funnel that suddenly diverges much further from the billing ledger than usual, or a RevenueCat figure that detaches from payouts overnight, points to an instrumentation or integration break — the event itself may be measuring the wrong thing, or the pipe between systems may have failed. The discipline of reliable end-to-end analytics is what makes the difference visible quickly. These breaks are real and common — the subscription industry has lived with known data-integrity issues such as the Google Play billing leak for years. The point of expecting structural variance is not to ignore drift; it is to recognise the moment ordinary disagreement turns into a genuine signal.
Frequently asked questions
Should Mixpanel and Stripe ever match exactly?
No — and if they do, be suspicious. Mixpanel counts behavioural events that can be lost to ad blockers, while Stripe counts cleared payments on an accrual schedule. They measure different populations on different clocks, so a stable gap between them is healthy. An exact match usually means one system is double-counting or both are mis-scoped.
Is RevenueCat or Stripe more accurate for monthly recurring revenue (MRR)?
Neither is "more accurate" — they answer different questions. RevenueCat models MRR and annual recurring revenue (ARR) from subscription state and estimated pricing, which is excellent for trend monitoring and cohort analysis. Stripe and store payouts report recognised, cleared money under the ASC 606 revenue-recognition standard, which is what finance should report externally. Use RevenueCat to watch the trend; use payouts to state the number.
How big a discrepancy is normal between these systems?
There is no universal figure, and you should distrust anyone who quotes one as a benchmark. The normal range is specific to your stack — your trial length, refund rate, store mix, and tracking setup all shape it. Establish your own baseline over a few reconciliation cycles, then treat sustained moves outside that baseline as the thing to investigate.
Reconcile the deltas, don't eliminate them
Three systems reporting three numbers is not a problem to solve once. It is a permanent condition of running behaviour, lifecycle, and money on separate, purpose-built tools — and the spread between them is structural, not a defect. The teams that handle it well stop asking which dashboard is right and start asking which one is authoritative for the decision in front of them. They assign one source of truth per question, document what every shared word means, and reconcile the gaps on a cadence so that ordinary variance never gets mistaken for a break — and a real break never hides inside ordinary variance.
If your team is losing review cycles arguing about which number is right instead of deciding from the right number, that is a reconciliation problem worth fixing at the system level. Let's talk — Applica Agency's A/B Testing & Data Analysiscan help you assign sources of truth and build the operating cadence around them.