
"We already have Mixpanel. Do we really need experimentation on top of that?"
It is one of the most common objections Applica Agency hears from small mobile teams deciding where to spend the next dollar of operational budget. Both tools cost money, both demand process time, and from the outside, they look like they answer the same question. The instinct to pick one is rational — until you realize that product analytics and A/B testing are not redundant layers of the same stack. They do different work, and treating them as substitutes is one of the most expensive misunderstandings a growth team can make.
This post draws the line. What product analytics is built to do, where it quietly stops being useful, what A/B testing adds that nothing else can, and the three thresholds that determine when experimentation earns its place. By the end, you will have a framework you can apply to your next product decision — not a sales pitch for tooling.
Why this question keeps coming up
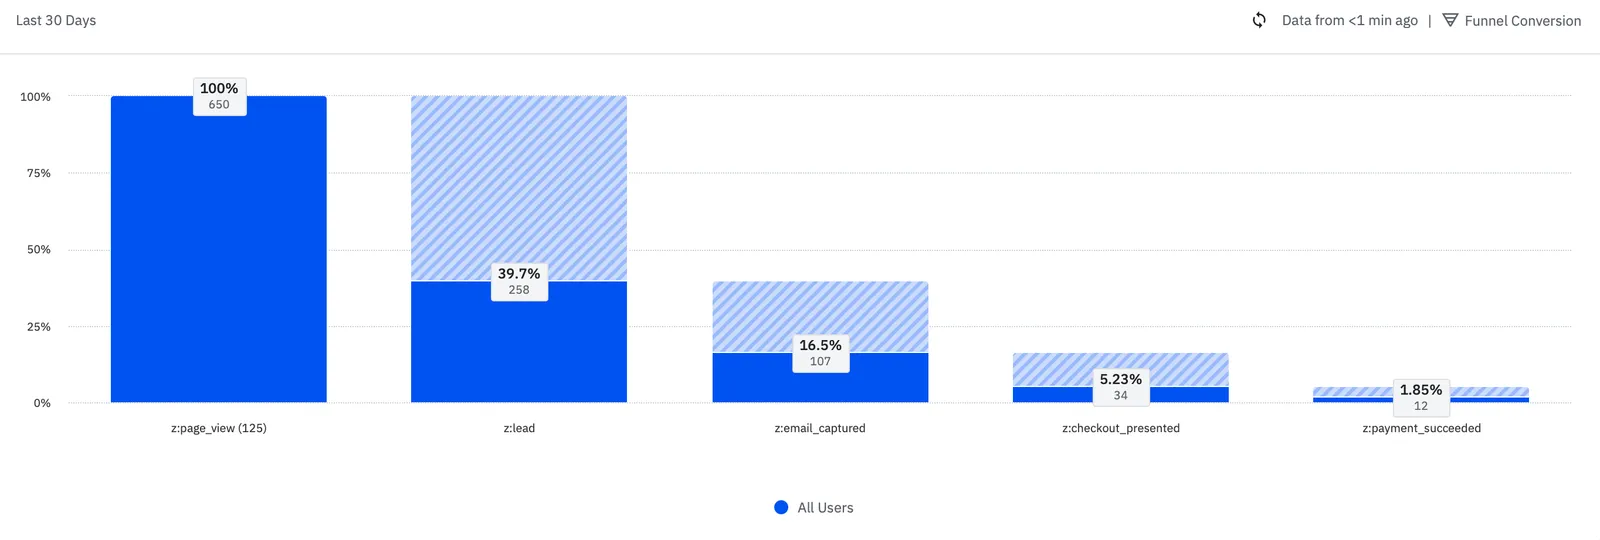
Analytics platforms create a powerful illusion. Dashboards look like answers. A funnel showing 32% drop-off at step three feels like a diagnosis, but it is only an observation — the equivalent of a thermometer reading. It tells you the temperature; it does not tell you what is causing it, and it does not tell you whether your proposed intervention will lower it.
The cognitive shortcut that follows is universal. Users who saw the new feature converted 12% better than those who did not. The team concludes the feature caused the lift and ships it everywhere. The reasoning is intuitive and almost always wrong. Users who saw the feature were, in many cases, the users most likely to convert anyway — high-intent segments, returning visitors, early-loyalty cohorts who would have converted regardless. Correlation read as causation is one of the most consistent failure modes in product analysis, and the credibility of the platform reporting it is no defense against the error.
For small teams, defaulting to analytics-only is not a mistake of principle but of resource calculation. Analytics is cheaper to set up, faster to learn, and does not require traffic minimums. Experimentation feels like a heavier commitment — tooling, process, culture. The hesitation is understandable. What is less understandable is how often this calculation is made without acknowledging what gets sacrificed.
The size of that sacrifice has been quantified. A peer-reviewed study published in Management Science tracked the time-varying adoption of A/B testing across high-technology start-ups: among firms that adopted the practice, performance improved by between 30% and 100% after a year of use, but adoption rates among early-stage firms remained strikingly low. The pattern is not that experimentation is unproductive for small teams. The pattern is that small teams underestimate what they are leaving on the table.
What product analytics is built to do — and where it stops
Product analytics is built to observe. Done well, it tells you what is happening across your product, where that activity sits in the funnel, how it is segmented across user types, and when it changes over time. Cohort retention curves, funnel drop-off, attribution modeling, event-level instrumentation — these are the workhorses of product analytics, and they form the foundation every growth team needs.
But every analytics tool, regardless of vendor, has three blind spots that no amount of dashboard sophistication can close — we'll cover each one below.
What product analytics is built for
Observation, attribution, segmentation, and funnel diagnosis. A well-instrumented analytics stack will tell you that conversion drops at a specific screen, that retention curves diverge by acquisition channel, and that one cohort behaves differently from another. These are what and where questions, and they are essential. They define the problem space and surface candidates for further investigation. They are the input to a hypothesis, not its validation.
Blind spot 1 — Causality
Analytics shows you that two things move together — feature adoption and retention, onboarding length and conversion, push notification volume and daily active users (DAU). It cannot tell you whether one caused the other, whether the relationship runs the other direction, or whether both are driven by a third variable you have not measured. This is a confounding variable problem — the same one that produces the famous correlation between ice cream sales and shark attacks (both rise in summer; neither causes the other). Evidence for causation comes from controlled experimental design, not from observational data, regardless of how clean the dashboard looks.
Blind spot 2 — The counterfactual
Analytics tells you what happened after you shipped a change. It cannot tell you what would have happened if you had not shipped it. Without a control group running in parallel, the lift you attribute to your intervention is contaminated by everything else that changed during the same period — seasonality, marketing pushes, an iOS update, a competitor's launch, a holiday weekend. The "before/after" comparison is the most-used and least-trusted technique in growth.
Blind spot 3 — Reliable per-segment lift estimation
Analytics shows that a feature correlates with higher engagement on average — but averages hide opposing effects via selection bias. The change might be helping one segment significantly while quietly hurting another. Without random assignment, you cannot detect this; you can only detect the net effect, which often looks flat or modestly positive even when the underlying segment-level dynamics are worth knowing about.
The mobile product version of the ice cream and shark attacks problem
The selection-effect version runs every day in dashboards across the industry. Users who complete onboarding fully convert at higher rates; therefore, longer onboarding causes conversion. Users who receive push notifications retain better, so more notifications lead to higher retention. Users who use the social feature have higher lifetime value (LTV) — therefore, the social feature drives LTV.
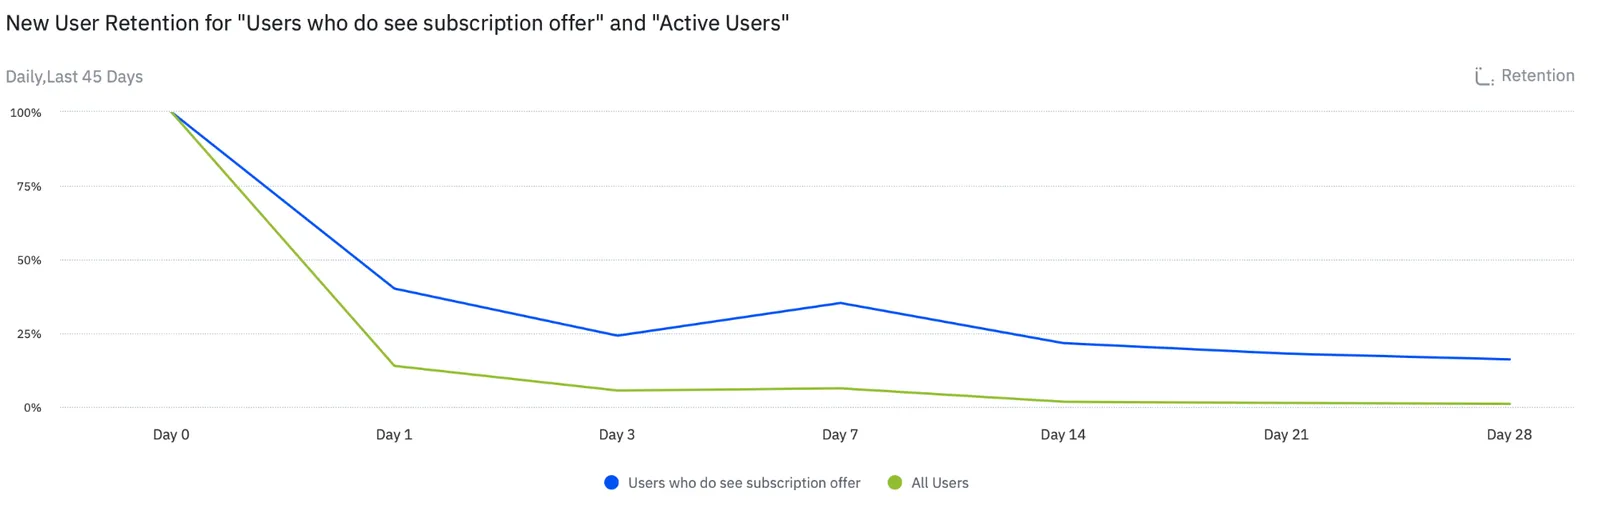
Each conclusion is plausible. Each is also defensible only after a controlled experiment confirms it, because in every case the simpler explanation is selection: the users who do those things were already the users most likely to convert, retain, or pay. Acting on the correlation without testing it is how teams ship "growth features" that do not move the metric at scale.
What A/B testing tells you that product analytics doesn't
A/B testing answers one question that product analytics cannot answer at all: does change X cause outcome Y, holding everything else equal?
Randomization is the mechanism. By assigning users at random to control and treatment groups, the test creates two populations that are statistically equivalent across all observed and unobserved variables. Any difference in outcomes between the groups can be attributed to the treatment with a defined level of statistical confidence. This is the only scalable way to isolate cause from correlation in a live product, and it is why companies that depend on continuous product iteration — from Booking.com to Netflix — run experimentation as a primary operating system rather than as an optional layer.
The output is also more useful than analytics output for decision-making. An A/B test produces a quantified lift estimate with a confidence interval — "this change improved trial-to-paid conversion by 4.2%, with a 95% confidence interval of 1.8% to 6.6%" — rather than a directional read like "users in this group seemed to convert better." The difference matters when you are deciding whether to invest the next sprint in scaling the change, abandoning it, or iterating on it. A/B testing also surfaces heterogeneous treatment effects: cases where a change works for one segment and fails for another. Analytics will average those segments together; a properly designed experiment lets you see them separately, and that is often where the actual learning lives.
The honest disclosure is that most experiments do not produce winners. Across the industry, well-designed experiments tend to deliver positive, statistically significant results only 10–20% of the time, with the remainder split between flat and negative outcomes. This is not a weakness of the method — it is the method's primary feature. As Kohavi, Tang, and Xu put it in their definitive guide to online experimentation, getting numbers is easy; getting numbers you can trust is hard. The losses and the flat results are how you avoid shipping changes that look promising in analytics and underperform in production.
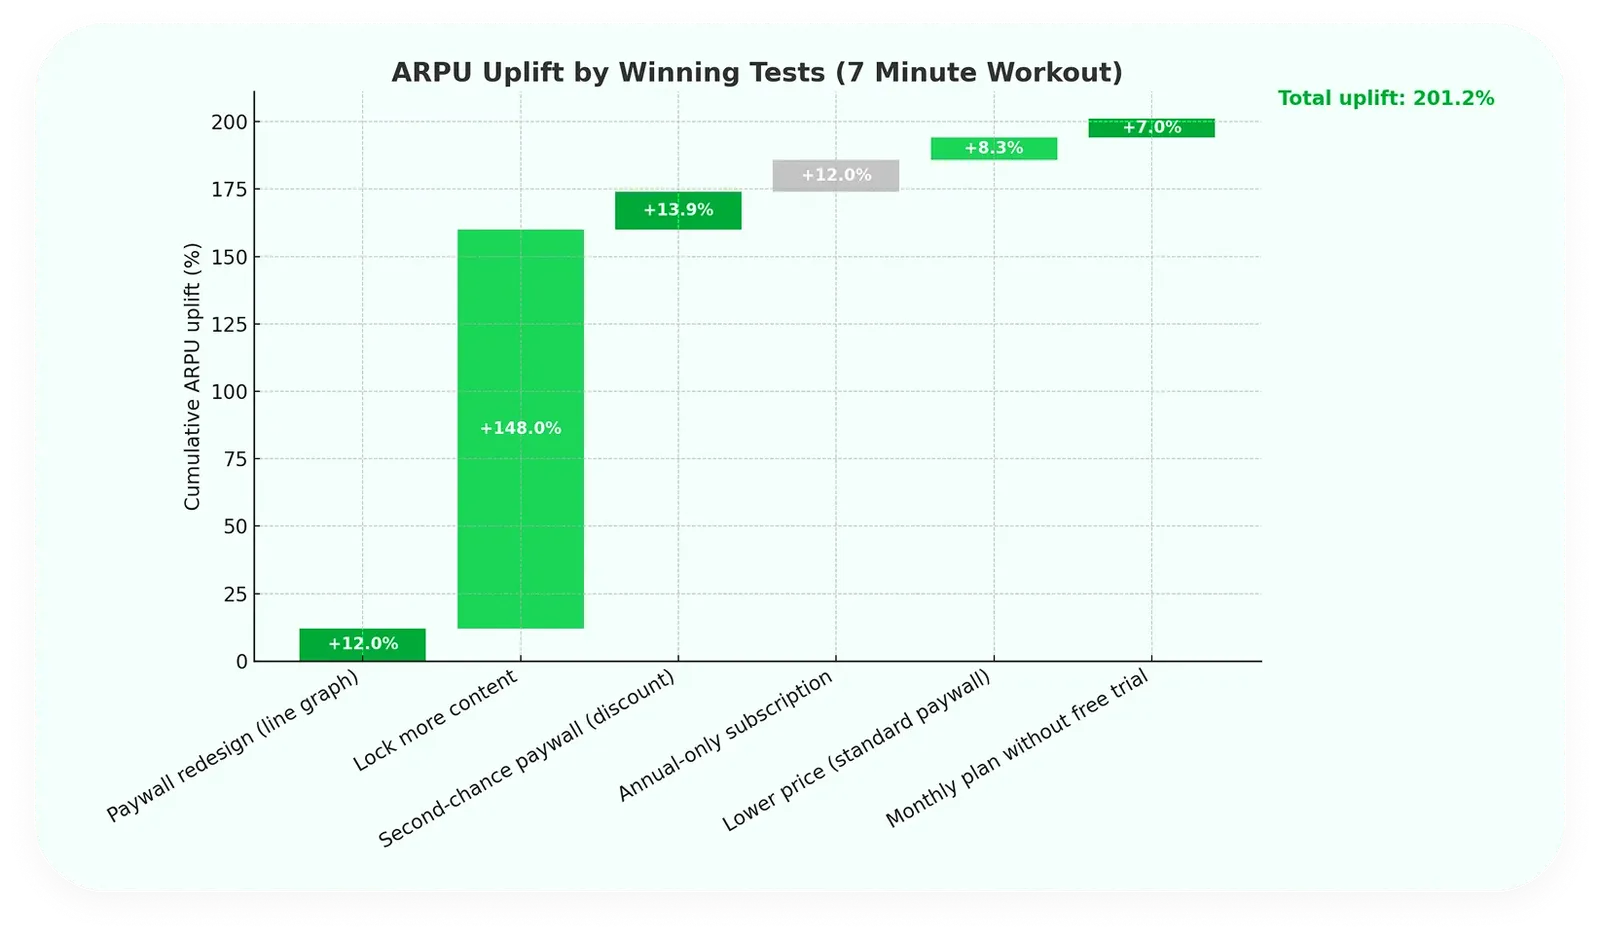
The compounding case for testing programs is well-documented. **7 Minute Workout added 50% to ARR through nothing more than disciplined testing cadence**: 27 hypotheses prioritized, tests sized for statistical validity, learnings documented across iterations. None of the individual tests produced an outsized standalone result. The compounding came from validating each change against a control, shipping the ones that actually moved the metric, and discarding the ones that only correlated with movement.
What goes wrong when teams run A/B tests before their analytics is solid
The most common failure mode in small-team experimentation is not running too few tests. It is running tests on top of an analytics foundation that is silently broken. A test produces a number; the team treats the number as a decision input; the number is wrong because the underlying instrumentation was wrong; the team ships the wrong change with full confidence. This is worse than not testing at all, because it dresses bad decisions in statistical credibility.
The 4 most destructive A/B testing mistakes small teams make account for most of the damage.
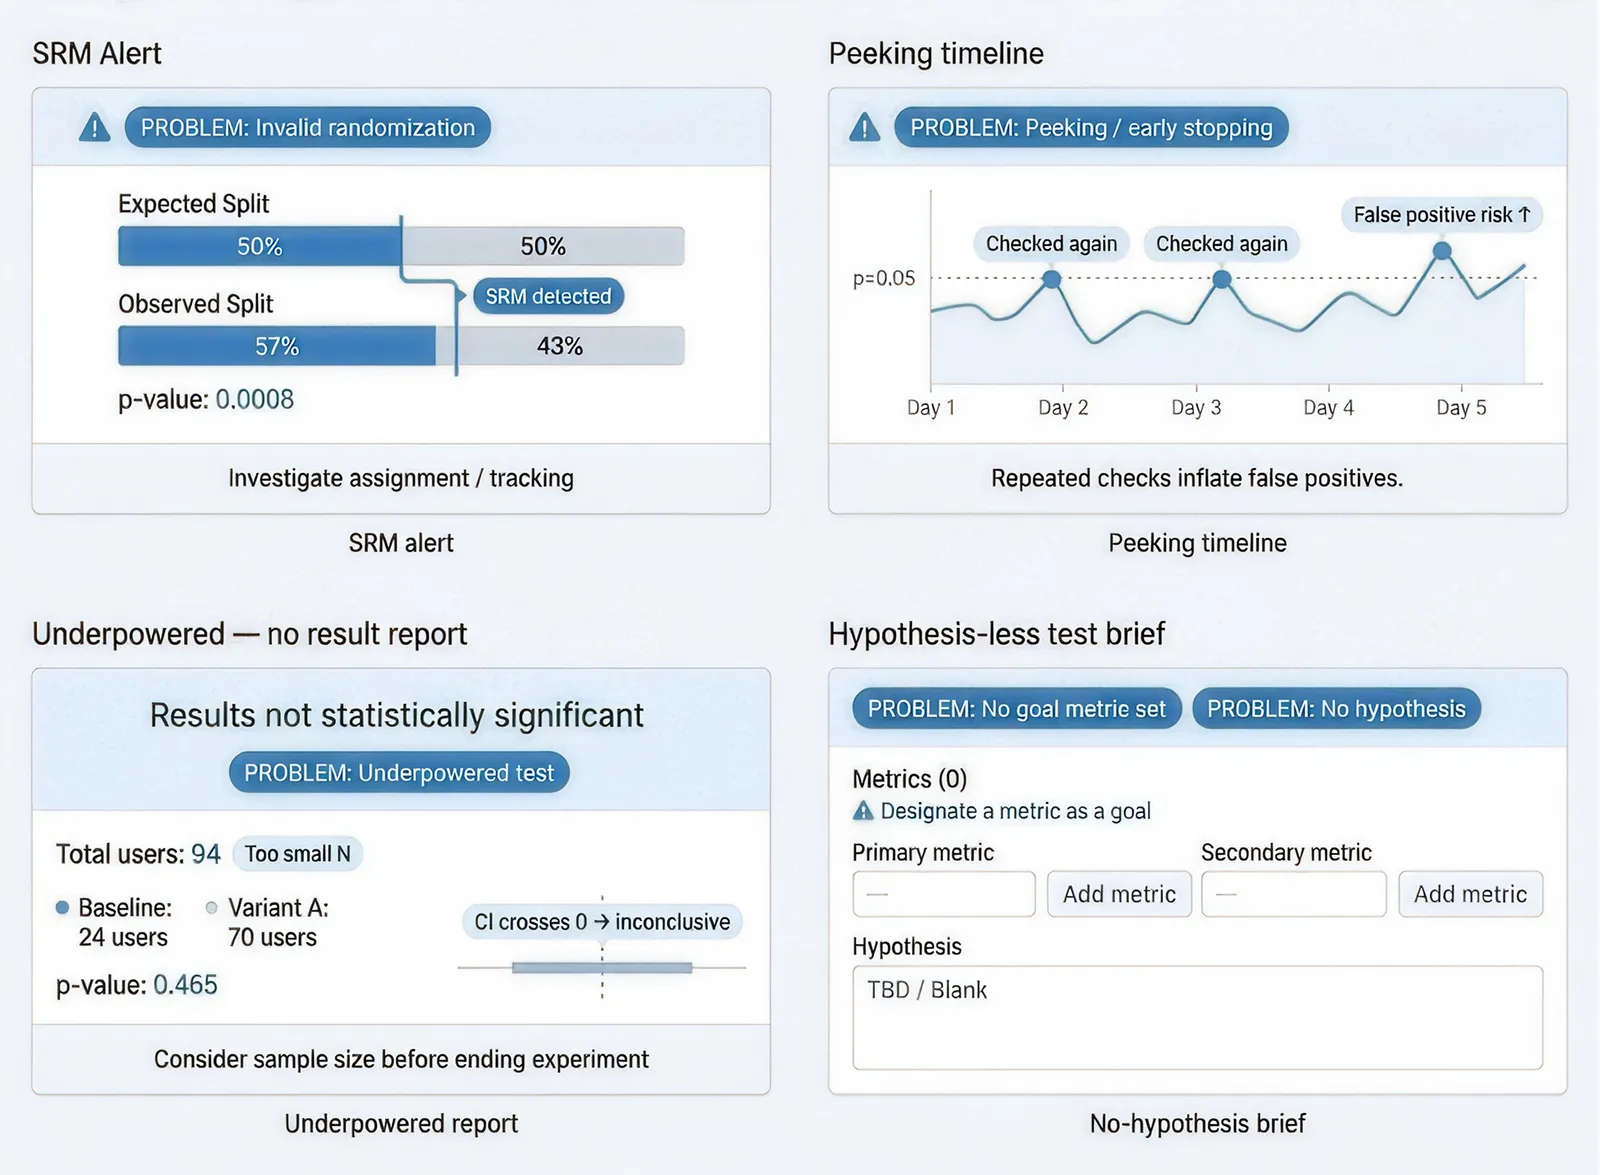
1. Broken event tracking under the test. If your conversion event fires inconsistently — duplicating in some sessions, missing in others, mis-attributing across sessions — the experiment platform will report lift that is not real, or miss lift that is. The canary for this problem is Sample Ratio Mismatch (SRM): when your intended 50/50 traffic split arrives at 53/47 or 55/45, your randomization or instrumentation has failed, and the test is invalid regardless of what the result reports. SRM affects roughly 6% of online experiments, and detecting it requires analytics infrastructure that can audit experiment assignment as carefully as it audits product behavior.
2. Peeking and stopping early. Watching the dashboard daily and calling a winner the first time the p-value drops below 0.05 is one of the most common — and most damaging — mistakes in experimentation. Repeated early checking inflates the false positive rate dramatically. Research from Optimizely has shown that uncorrected peeking can push false positive rates above 25%, meaning roughly one in four "winners" called this way is statistical noise. The fix is methodological — sequential testing, predefined sample sizes, fixed-horizon analysis — but it requires a team that knows the trap exists. Evan Miller's primer on how not to run an A/B test is the standard reference.
3. No baseline. Without reliable analytics, you do not know your control's baseline conversion rate — and without that, you cannot size the test correctly. You will not know whether a "no result" outcome means the change had no effect, or whether the test was simply too small to detect the effect that exists. Most documented mistakes in experimentation programs cluster around upstream planning failures, not statistical sophistication, and inadequate baseline data is one of the biggest.
4. Testing without a hypothesis. Running variants because "let's see what works" generates statistical noise rather than learning. The hypothesis is what makes a test interpretable when it loses — it tells you what you believed, what the data said about that belief, and what the next test should investigate. Without that, you are not running an experimentation program; you are running a slot machine.
The clearest illustration of this pattern in Applica Agency's portfolio: **FitMind, a meditation app we worked with, lifted average revenue per user (ARPU) by 50% across five A/B tests in two months** — but only after fixing the in-app event tracking that had been silently breaking experiment readouts for months prior. The testing infrastructure had failed before the tests did, because the analytics layer it sat on top of was unreliable. Once the foundation was fixed, the first-time user experience (FTUE) testing program produced compounding results almost immediately.
When A/B testing earns its place — three thresholds
Not every change needs a test. Running experiments on every minor copy edit burns time, pollutes your analytics, and trains your team to treat statistical infrastructure as a procedural checkbox. The right question is not whether to test everything, but how to identify the changes where testing meaningfully improves your odds. We use three thresholds.
Threshold 1 — Reversibility
If you can ship a copy variation, a button color, or a layout adjustment and roll it back in a deploy, the cost of being wrong is low — sometimes ship-and-observe is the rational choice. If the change is structurally hard to reverse — a paywall redesign, a pricing change, a new onboarding architecture — the bar to ship without validation rises sharply. Reversibility is a risk-pricing question that maps directly to how much rigor a decision deserves, and it sits at the heart of mobile paywall design best practices for any subscription app.
Threshold 2 — Traffic / sample size
A/B tests rely on statistical power, and statistical power requires sample size. The exact threshold depends on your baseline conversion rate and the minimum detectable effect you care about, but a useful rule of thumb is that most mobile A/B tests need at least 1,000 users per variant for moderately sensitive metrics — and frequently more for downstream revenue metrics with high variance. Below that, the test will be underpowered and inconclusive regardless of methodology. For small teams without traffic, focus testing where the volume exists — typically at the top of the funnel — and rely on qualitative research and sequential measurement elsewhere.
Threshold 3 — Revenue at stake
Match testing rigor to revenue exposure. A 5% paywall change shipped on intuition costs more than the same change to a button color. The decisions that compound over time — pricing, packaging, the activation moment, the core monetization surface — deserve experimental validation almost regardless of reversibility, because the cost of being wrong is paid every day until the next change ships.
A useful operating heuristic: if any one of the three thresholds is high — irreversibility, sufficient traffic, meaningful revenue exposure — test it. If all three are low, ship and learn from analytics post-hoc. The structured retrospective process for documenting test learnings ensures the wins compound across cycles.
How Applica Agency approaches the analytics + experimentation pairing
At Applica Agency, the operating sequence is straightforward: instrument first, observe to surface candidates, hypothesize, test, ship, re-observe. The pairing is not analytics or testing — it is analytics → testing → analytics, in a loop. Each phase produces an input the next phase needs.
Before any test starts, we ask one diagnostic question: what does the data already tell us, and what does it specifically not tell us? The first part defines the problem; the second part defines what experimentation is for. If analytics already tells us the answer with high confidence — a critical bug, a broken funnel step, an unambiguous behavior pattern — we ship the fix and verify post-hoc. If analytics surfaces a candidate but cannot distinguish between causal and selection effects, that is where a test earns its place.
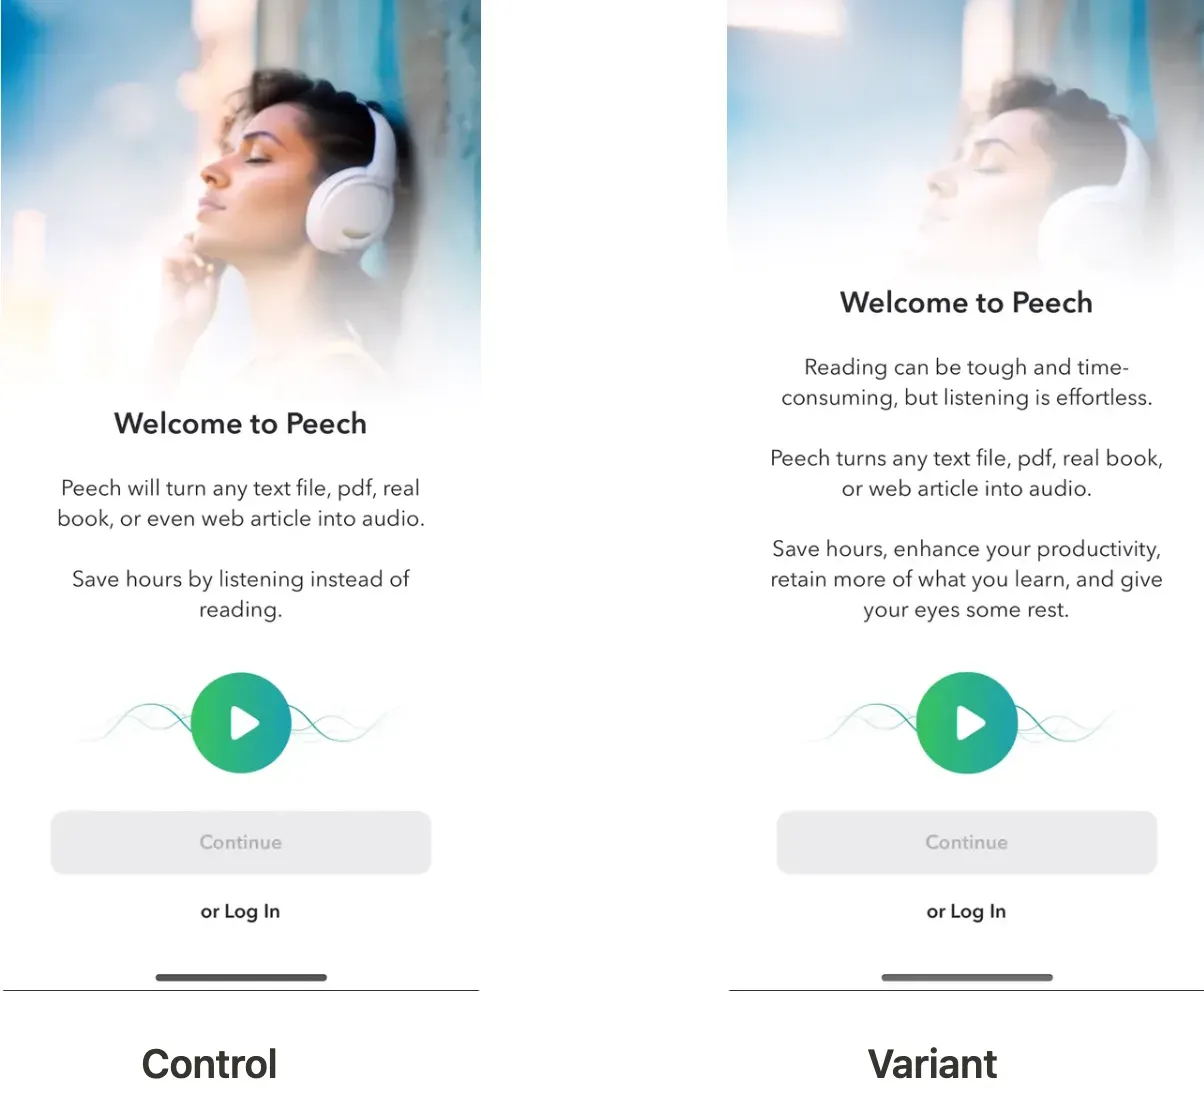
A concrete example: Peech, a text-to-speech reader app, had a welcome screen that listed product features rather than answering "what's in it for me." Jobs-to-be-done (JTBD) interviews surfaced the gap. The hypothesis was counter-intuitive — that benefit-led copy, even though it ran nearly twice as long as the existing version, would outperform the feature list. A 50/50 split test on US first-time users over 25 days lifted LTV by 30% at 99.8% confidence. Analytics couldn't have proved that. The welcome screen wasn't broken in any visible way on the dashboard. Only the controlled test established that the rewrite was the cause of the lift, not seasonality, not a paid mix shift, not the random walk of weekly conversion noise.
Operationally, this looks like a weekly hypothesis review where candidates are scored for impact, traffic feasibility, and reversibility; tests sized for the minimum detectable effect that matters commercially; and a structured retrospective process for documenting learnings, including from tests that did not win. The goal is not testing volume. The goal is a stable rate of validated decisions, with each result feeding the next round of hypotheses — supported by the analytics setup that makes tests like this readable underneath.
Frequently asked questions
Can product analytics ever prove causation?
Not on its own. With careful design, quasi-experimental methods like difference-in-differences, regression discontinuity, or propensity score matching can approximate causal estimates from observational data — and where randomization is impossible, these techniques are valuable. But for the day-to-day product decisions mobile teams make, randomized controlled testing remains the standard.
How much traffic do I need before A/B testing is worth it?
For moderately sensitive metrics like trial conversion or activation, the practical threshold sits around 1,000+ users per variant per week, with more required for high-variance revenue metrics. Below that, test selectively: focus on top-of-funnel surfaces where volume is highest, run longer cycles, and rely on qualitative research for the rest.
What if my test results contradict what my analytics show?
Trust the test. Analytics measures correlation; the test measures causation. The contradiction usually means the analytics signal was driven by a confounder — a segment difference, a temporal effect, a self-selection pattern — that the random assignment in the test controlled for. This is exactly the situation experimentation is designed to catch.
Where do I start if I have neither product analytics nor A/B testing in place?
Analytics first. You cannot run trustworthy experiments on top of broken instrumentation. Build event tracking that you trust, get baseline conversion rates you can defend, then layer experimentation on top. Applica Agency's 13 app growth metrics worth tracking is a useful starting list.
Three takeaways
First, product analytics observes; A/B testing intervenes — they answer different questions, and treating them as substitutes leads to causal claims analytics was never built to support.
Second, experimentation earns its place when reversibility, traffic, or revenue exposure crosses a threshold — not on every change, but on the changes that compound. Smaller apps don't need to skip experimentation. They need to test bigger interventions with longer windows.
Third, the failure mode is rarely choosing one tool over the other. It is running tests on a broken analytics foundation, or making causal calls from analytics alone, and shipping confident decisions built on unreliable signal.
If your team is making product calls on dashboard reads alone and you're looking for a reliable partner to start A/B testing and turn data into growth, let's talk.