
Product Optimisation ROI: How Long Until You See Results (and What Determines the Timeline)?
A founder sits across from a growth agency on a discovery call. The deck slides past methodology and into pricing. Before the agency can finish describing the engagement, the question lands: how long until we see ROI? Whatever number comes back — six weeks, three months, ninety days — almost certainly compresses a much wider truth into a clean line.
The honest answer is conditional. The same engagement type — say, a paywall optimisation sprint for a subscription app — can deliver its first measurable revenue lift in 4 weeks for one client and 4 months for another. The variance isn't sloppiness on the agency side; it's structural. Conditions inside the client's product, traffic, and decision cadence move the timeline more than the engagement structure does.
What follows: the 4 conditions that compress or extend the product optimisation ROI window, the timelines you can realistically expect by engagement type — anchored in concrete client results, not category averages — and the agency claims that should make a buyer slow down.
Why "how long until ROI?" doesn't have one answer
Two patterns show up across agencies that promise fixed weeks.
The first is overpromising. A clean "six-week to first lift" forecast collapses the first sprint into an idealised version of itself — high-traffic app, clean instrumentation, single high-leverage hypothesis ready to ship. Real subscription apps rarely arrive at the engagement in that shape.
The second is underpromising. "Expect 3 to 6 months before meaningful results" is a defensible answer, and respected CRO operators often frame it that way — but it dodges the question of which clients land at 4 weeks and which land at 6 months. Without naming the variables, the buyer can't tell which side they're on.
A more useful frame: 4 conditions determine where on that spectrum a particular engagement lands. Three of them sit inside the client's control, which is good news for anyone willing to do the upstream work.
The 4 conditions that determine speed-to-impact
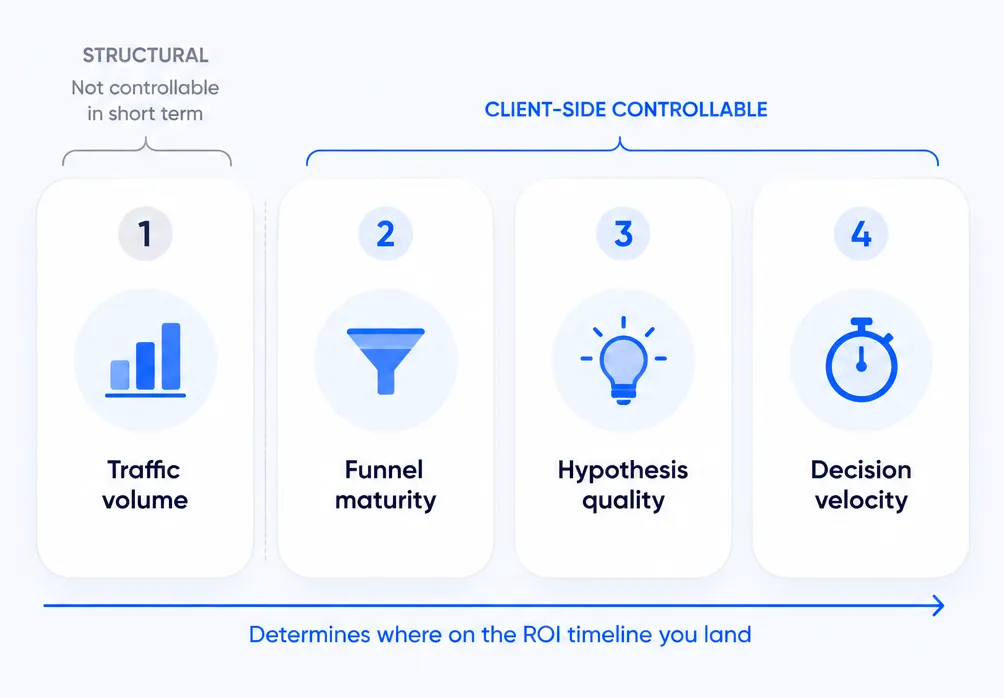
1. Traffic volume sets the statistical floor
Sample size and Minimum Detectable Effect (MDE) work against each other. To call a small lift — say, a 5% relative change in trial-to-paid — at 95% confidence and 80% statistical power, most subscription experimentation guides recommend at least 1,000 users per variant and a 2-to-4-week minimum runtime, with larger samples preferred for low-baseline conversion rates. Convert's framework for test duration makes the underlying logic concrete: smaller expected effects need bigger samples and longer windows, regardless of what an early read seems to be saying.
Apps below the volume floor don't need to skip experimentation. They need to either accept longer test windows, or prioritise interventions whose expected effect size is large enough to detect with a smaller sample. A welcome-screen rewrite that lifts Lifetime Value (LTV) by 30% needs far less traffic to validate than a button-colour change that might move conversion by 1.5%. The discipline is to test things big enough to move a number the smaller sample can see.
2. Funnel maturity determines what's testable on day one
If the analytics, paywall infrastructure, or event taxonomy are broken, the first sprint goes to fixing them — not to lifting revenue. That extends the ROI clock by weeks, sometimes longer. (More on why broken events produce confident wrong answers in our experiment-history review framework.)
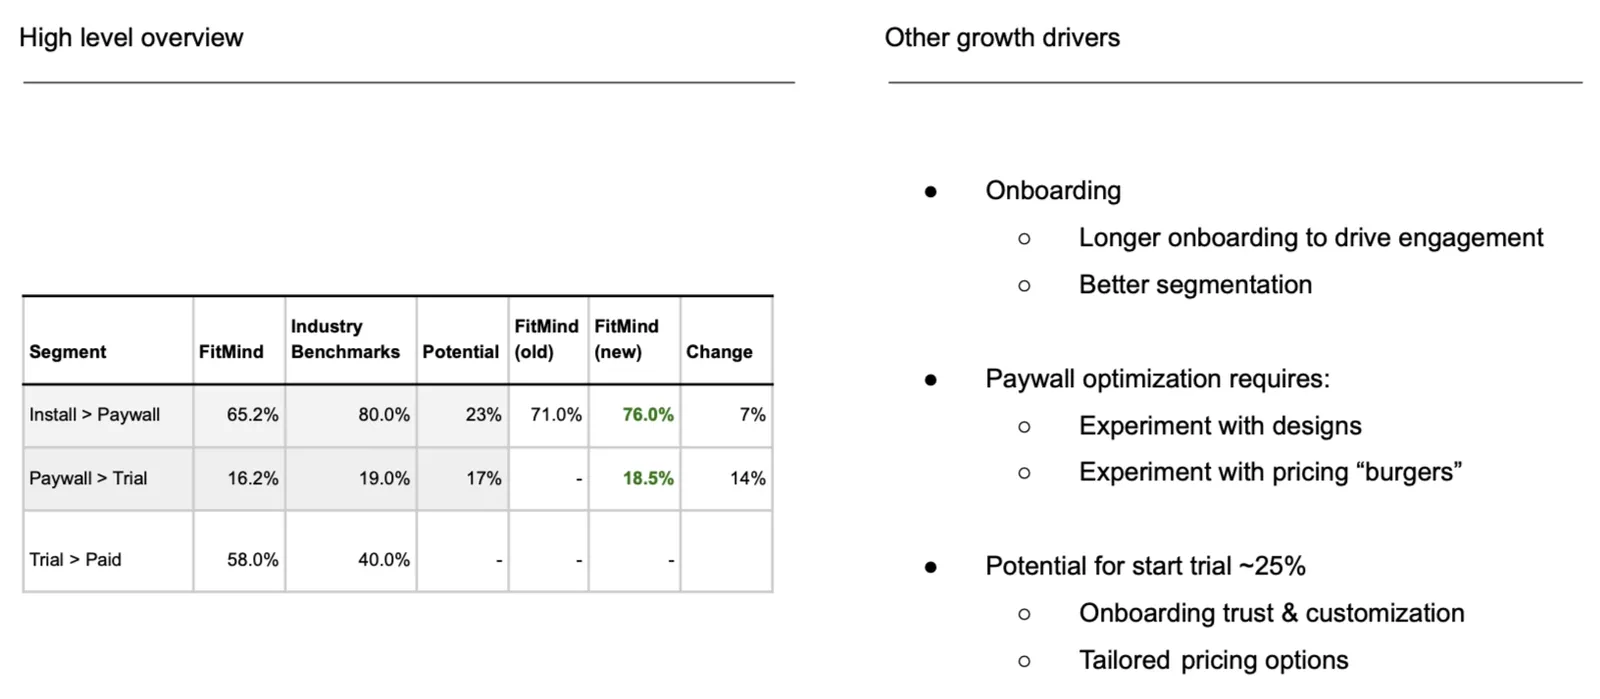
FitMind, a meditation app, illustrates the dependency cleanly. Across 5 A/B tests, Average Revenue Per User (ARPU) rose 50% in 2 months — but the meaningful work landed after the in-app event tracking was fixed first. Without the foundation work, the same 5 tests would have read as noise. The instrumentation effort wasn't billable revenue lift; it was the precondition for revenue lift to become visible.
3. Hypothesis quality compresses or extends the timeline
A single high-leverage hypothesis, validated in one test cycle, can produce the kind of lift that takes a generic backlog ten cycles to match. The variable isn't experimentation cadence — it's what enters the cadence.
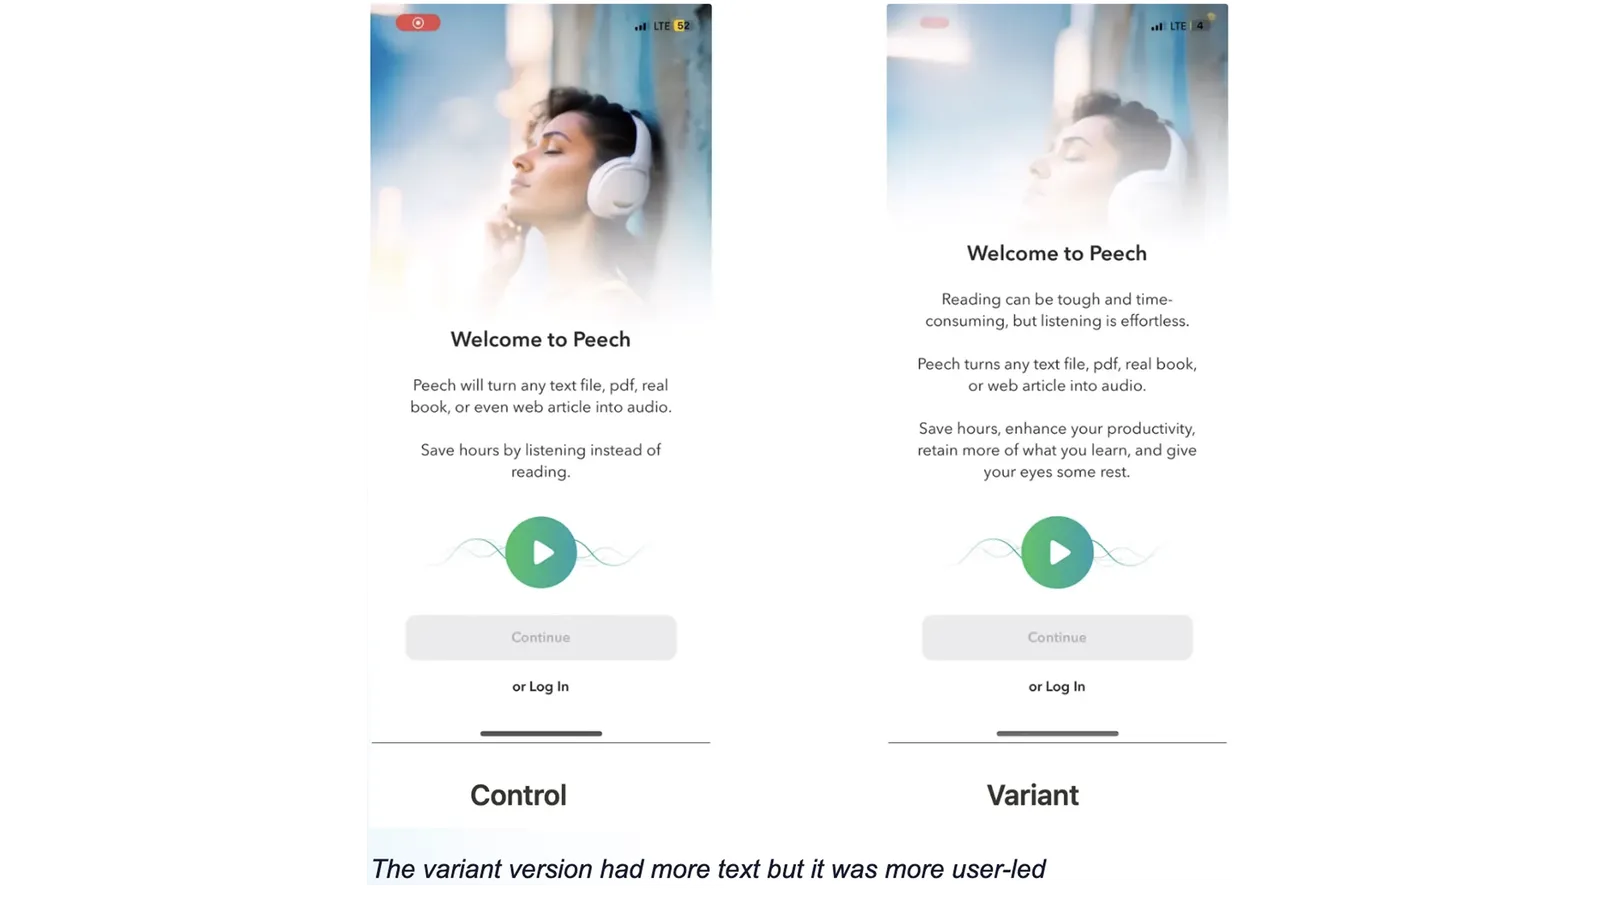
Peech, a text-to-speech reader app, ran a single welcome-screen copy test that lifted LTV by 30% at 99.8% confidence over roughly 25 days. The test wasn't fast because the team ran more variants. It was fast because Jobs-to-be-Done (JTBD) interviews surfaced the precise gap between what the welcome screen said and what new users actually needed to hear before continuing. The hypothesis was sharp before any code shipped.
4. Decision velocity — the variable most teams don't think about
Tests can win in 3 weeks. If approval and rollout take 6 more, the ROI clock runs to week 9, not week 3. The compounding loop only starts when shipped winners produce revenue — not when readouts come back significant.
This condition sits entirely inside the client's control. Naming it now sets the cadence expectation for the rest of the engagement: a weekly experiment review, a 48-hour rollout approval window, a single owner of the source-of-truth dashboard. Without that scaffolding, the agency can run a textbook program and the client still won't see ROI on the originally-quoted timeline.
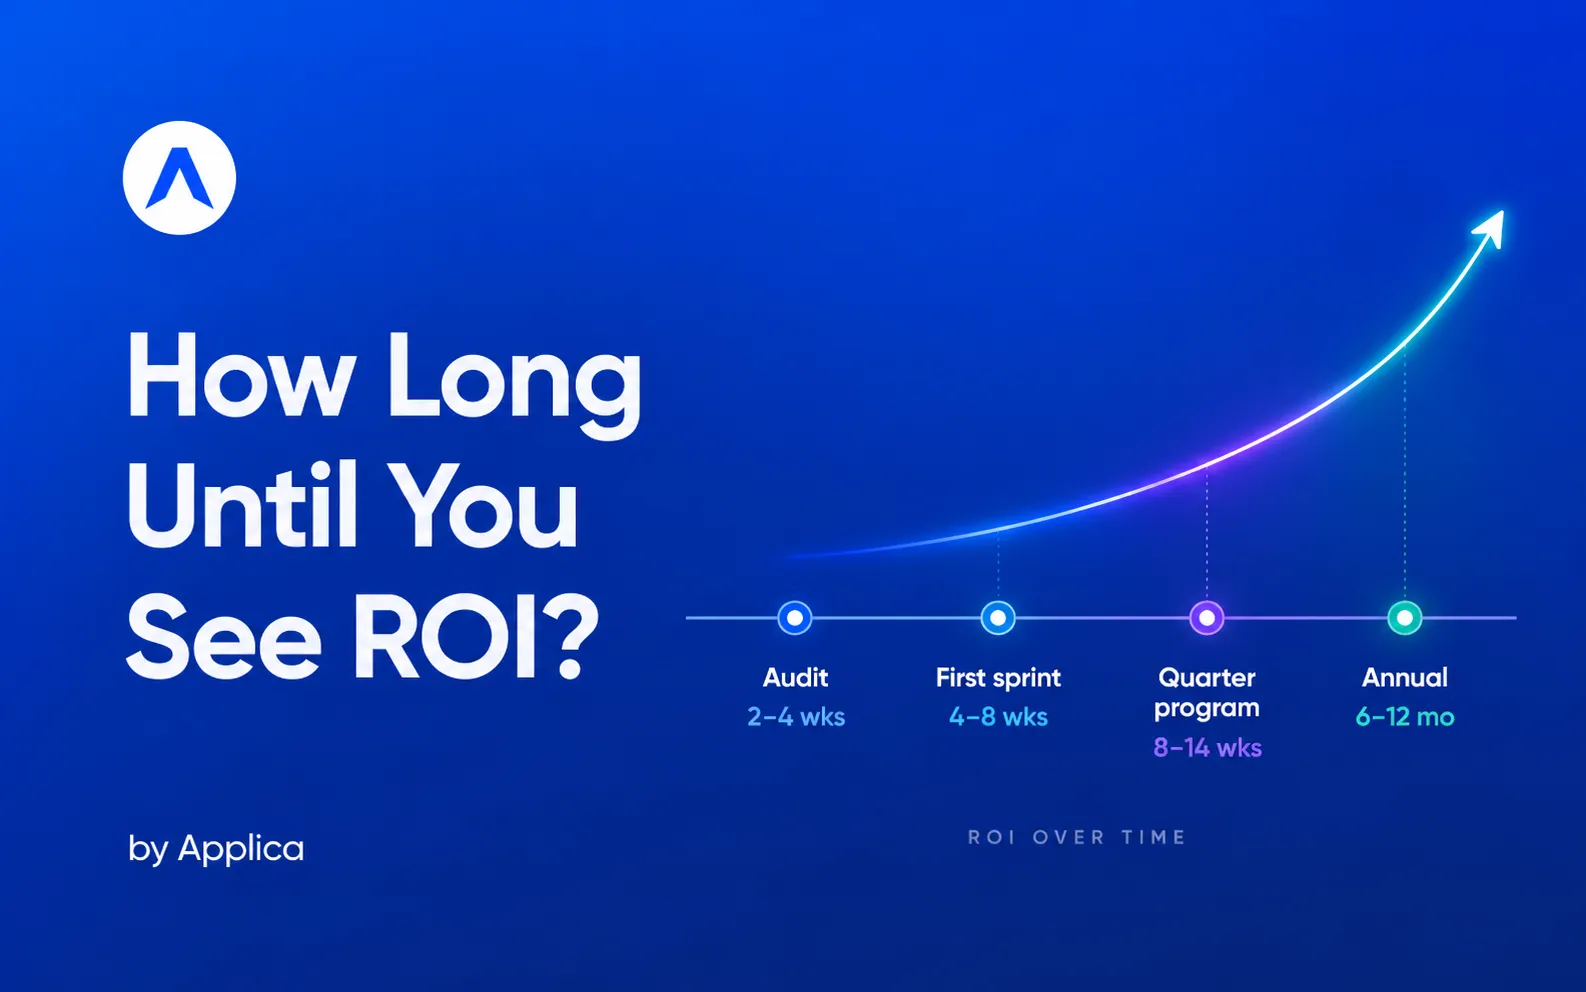
What ROI looks like by engagement type — realistic timelines
Audit-only (2–4 weeks)
The first deliverable from any product optimisation engagement is diagnostic, not financial. A clean audit produces a prioritised hypothesis backlog, an event-taxonomy gap report, baseline conversion metrics, and a 90-day experiment roadmap. Any agency promising revenue lift in the first month from an audit-only scope is misrepresenting what an audit can do.
This phase is short and high-leverage when scoped honestly: 2 to 4 weeks, focused on making the next 90 days of testing readable. Most credible CRO agencies frame the first month as foundation and first tests, with 5–15% improvement landing as the early-cycle range when conditions allow.
First sprint (4–8 weeks)
This is where the first measurable lift lands when conditions are favourable. eCommerce CRO programs typically show their first measurable improvement at the 4–8 week mark, and the pattern transfers to subscription mobile when the analytics is clean and the hypothesis is sharp.
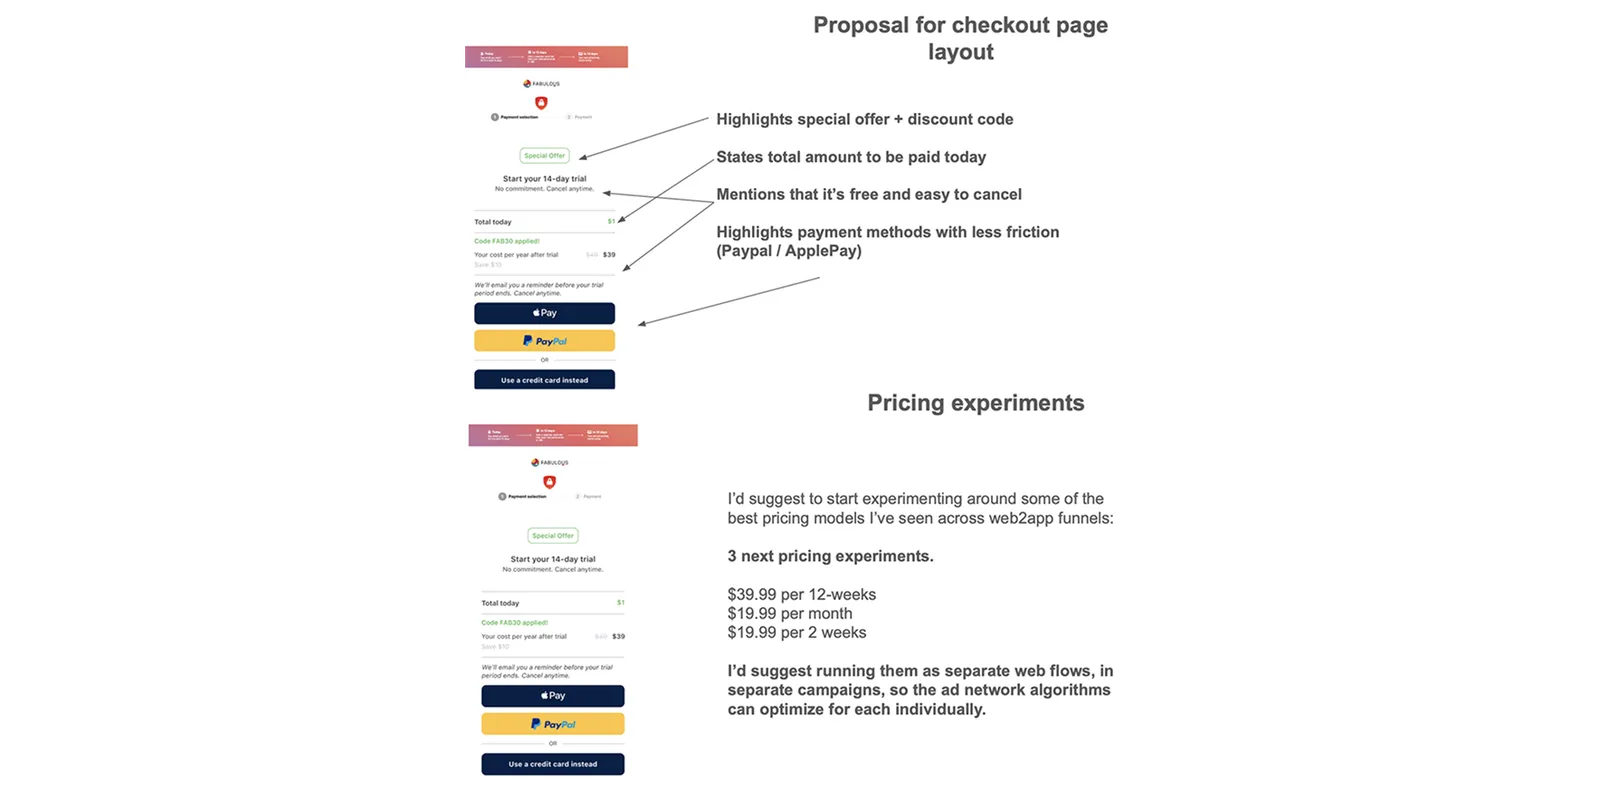
Fabulous, a self-care app, added 40% to ARPU in 4 weeks via Web2App pricing experiments. Why it worked at 4 weeks specifically: high Web2App traffic volume, a single high-leverage variable (pricing), and clean event instrumentation already in place. Each of those is itself a precondition. Apps missing any of the three will see the same engagement shape land closer to 8 weeks for first lift — sometimes longer.
Quarter-scale program (8–14 weeks)
The compounding window. Multiple tests stacked, multiple winners shipped, with cumulative effect that wouldn't be visible from any single experiment. Subscription pricing tests in particular need at least a full billing cycle to measure their real impact on churn, renewals, and lifetime value — which extends the readout window well past what website-style CRO benchmarks suggest.
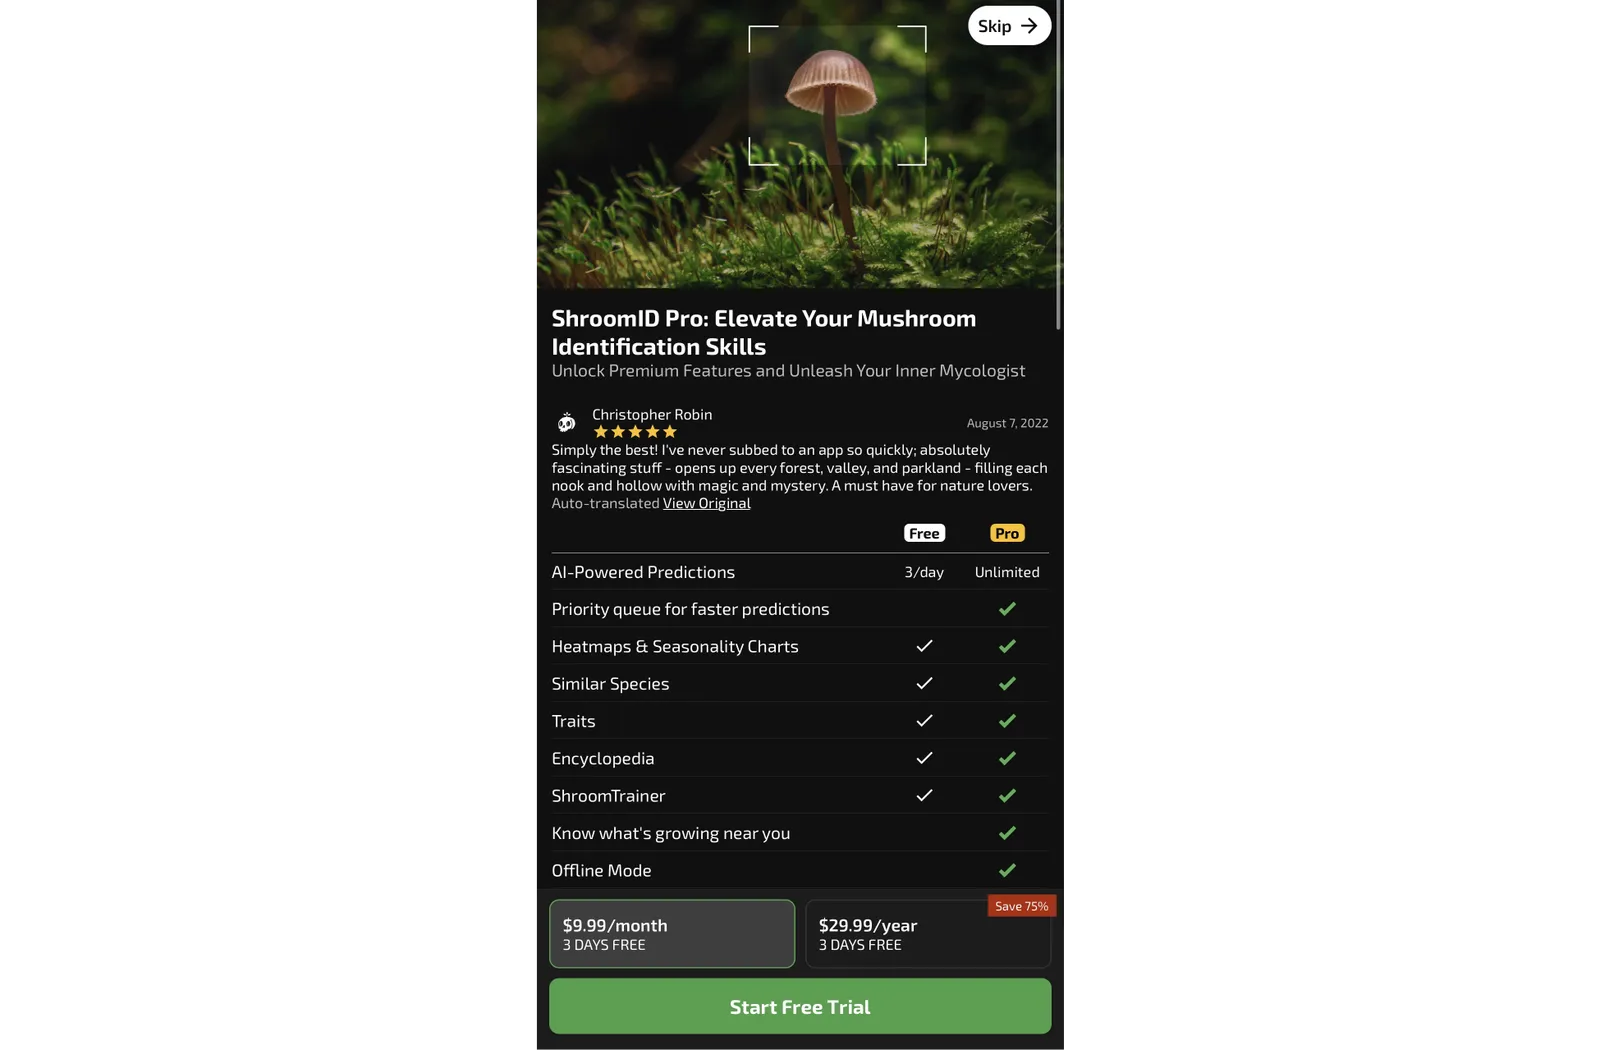
ShroomID, a mushroom identification app, added 60% to Average Revenue Per Paying User (ARPPU) after 3 monthsfrom pricing strategy work. The quarter-scale tier is also where general CRO benchmarks — 10–35% cumulative conversion improvement across months 2 and 3 — start becoming a reasonable yardstick for subscription work, with the caveat that ARPU and LTV are the better measures of real ROI than top-of-funnel conversion alone.
Full annual retainer (6–12 months)
The disciplined-program horizon. Compounding effects only become visible at this scale.
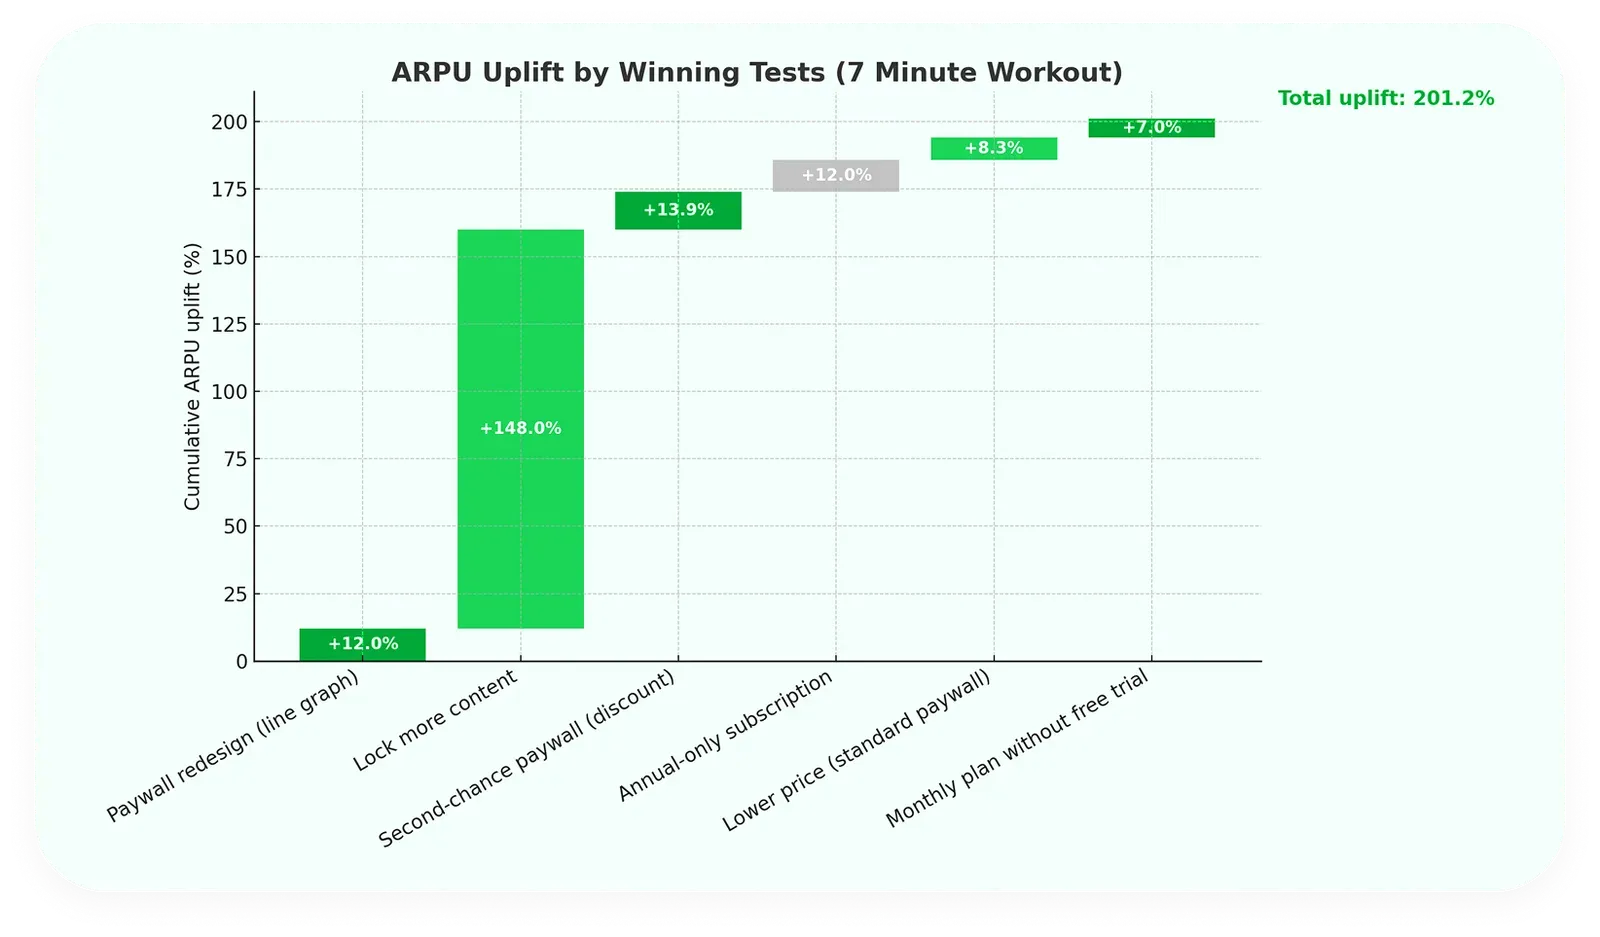
7 Minute Workout, a fitness app, added 50% to Annual Recurring Revenue (ARR) through a structured A/B testing program that ran 27 hypotheses across onboarding, paywall, and retention. The win rate landed around 22% — meaning roughly four of every five tests didn't produce a shippable winner. Agencies promising a 50%+ win rate are quoting a number that compounds the wrong way: high stated win rate × low throughput produces less ARR than low win rate × high throughput. The metric to anchor expectations on isn't win rate per test. It's throughput × win rate × ship velocity.
For longer-horizon revenue work, the LTV measurement window itself spans multiple billing cycles — which is why programs designed around quarterly readouts under-report what an annual engagement actually delivers.
What clients can do to accelerate ROI on their side
Speed isn't only the agency's responsibility. Three levers sit inside the client's control, and naming them upfront usually saves 4 to 6 weeks across a 6-month engagement:
- Decision velocity — approve test launches and rollouts within the agreed cadence. A 48-hour rollout approval window is the difference between 5 winners shipped in a quarter and 3.
- Source-of-truth alignment — decide which dashboard wins when Mixpanel and RevenueCat disagree, before the first test launches. Every meeting that starts with a number argument is a meeting that doesn't ship a winner.
- Hypothesis access — make user research, JTBD interviews, and qualitative data accessible from week one. The instinct to let the agency figure it out from scratch feels rigorous and usually adds weeks before the right hypothesis surfaces.
The clients who land closest to the 4-week end of the timeline spectrum are the ones who treat the engagement as a shared cadence, not an outsourced deliverable.
Red flags in agency timeline promises
Four patterns to disqualify a pitch:
- Fixed week counts without conditions. "You'll see lift in 6 weeks" with no qualification on traffic volume, funnel maturity, or hypothesis depth means the agency hasn't priced the engagement based on your specific conditions — they've quoted a marketing number.
- First-month revenue projections from an audit-only scope. Real first-month deliverables from an audit are diagnostic, not financial. An agency promising revenue lift in month one is either skipping the diagnostic phase or selling you something other than what they're calling it.
- No instrumentation audit in scope. Running tests on broken event tracking produces confident wrong answers — and decisions shipped on confident wrong answers are the most expensive kind to unwind. If the proposal doesn't include an event-taxonomy audit as a Phase 0 deliverable, ask why.
- Decision velocity assumed but not contracted. The agency assumes you'll approve rollouts in 48 hours; the proposal doesn't say so. Six months in, when the ROI hasn't materialised, the conversation becomes mutual finger-pointing. Good agencies build the cadence into the engagement and tell you what their side of the cadence looks like before you sign — which is part of what a serious CRO partner brings to the contracting stage, not just the execution stage.
Frequently asked questions
How quickly can a small subscription app see ROI from product optimisation?
Small apps face a structural disadvantage on the traffic side: smaller samples need longer windows or larger expected lifts to read clean. Standard A/B testing guidance suggests at least a 7-day minimum per test, often 2 to 4 weeks for confidence— and subscription tests typically need a full billing cycle on top of that. A small app with clean instrumentation, a sharp hypothesis, and a Web2App or paywall lever can land first measurable revenue lift in 6–10 weeks. Without one of those conditions, expect closer to 12–16 weeks.
What's a realistic first-month deliverable from a product optimisation engagement?
A prioritised hypothesis backlog ranked by expected impact and effort, an event-taxonomy gap report identifying broken or missing events that need to ship before tests can read clean, a baseline metrics snapshot, and a 90-day experiment roadmap. Revenue lift in month one is rare and usually means the agency skipped the diagnostic phase — which produces faster first numbers and worse second-quarter compounding.
Can an audit-only engagement produce ROI on its own?
Indirectly, yes. An audit doesn't lift revenue itself, but it prevents the revenue losses that come from shipping decisions on broken data. The ROI of an audit is best measured against the counterfactual: how much the team would have spent on tests that didn't read clean, or shipped wrong winners from confident wrong answers. For teams already running tests but feeling like results aren't compounding, the audit is usually the highest-leverage spend in the first quarter.
Three takeaways
First, realistic ROI windows for subscription product optimisation: 4–8 weeks for the first measurable lift when conditions align; 8–14 weeks for compounding gains across multiple shipped winners; full annual retainers compound across quarters in ways quarterly readouts under-report.
Second, conditions matter more than calendar weeks. Traffic volume, funnel maturity, hypothesis quality, and decision velocity together determine where on the timeline an engagement lands more than the engagement structure does.
Third, agency timelines that don't qualify on conditions are usually wrong by half — and which side they're wrong on tells you something about the agency. Fixed week counts in either direction are a tell. The conditional answer is the honest one.
If you're trying to decide whether product optimisation will deliver ROI on a timeline that matches your runway, the right next step is to map your specific conditions before signing — not to negotiate a shorter timeline. Apply for a free product optimisation audit from Applica Agency.