
Two of Meta's biggest ad surfaces were reshaped inside a single year, and both changes hit the same question: where should your spend actually run? In late January 2026, Meta expanded Threads ads to all markets globally, opening a new inventory pool across an app with more than 400 million monthly active users. Then in March 2026, Meta consolidated Stories and Reels into a single unified 9:16 creative safe zone, collapsing four vertical surfaces into one creative spec. If you are planning your Meta ad placements in 2026, you are planning against inventory that looked different twelve months ago.
The stakes are not abstract. During the Threads land-grab, benchmark data placed its CPMs roughly 30% to 40% below Instagram feed, and vertical video now dominates consumption, with Reels alone reaching about 35% of Instagram ad impressions in Q2 2026. Cheaper impressions and more of them sounds like a straightforward win. It rarely is.
Here is the argument that most placement guides miss. Meta ad placements in 2026 are a revenue-quality decision, not a cost decision, because the cheapest placements routinely win the install and lose the LTV. This guide does two things: it maps the full 2026 placement inventory so you know where to run and what to expect, and then it shows you how to win, using real account data on why the placement that looks weakest on acquisition cost can be the strongest on downstream value.
What are the Meta ad placements in 2026?
Meta ad placements in 2026 span seven main surface groups: Feed (Facebook and Instagram), the unified vertical 9:16 surfaces (Stories and Reels), Facebook Reels, Explore, Search, Marketplace, the Audience Network, and the newly global Threads inventory. Most accounts still concentrate delivery in Feed and the vertical surfaces, but the full inventory is wider than the three placements teams tend to name.
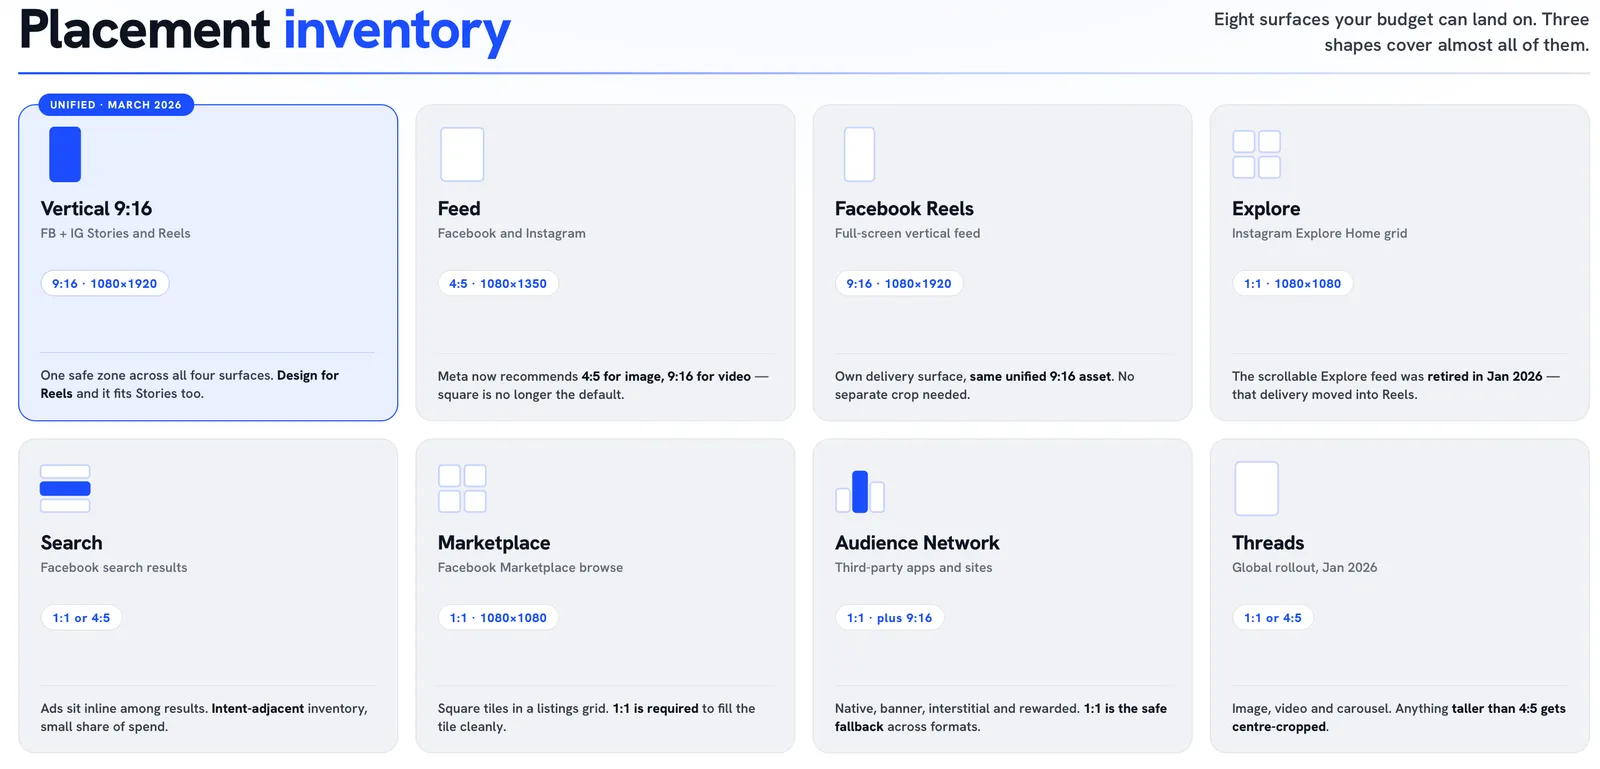
The practical shift for 2026 is that the surfaces have consolidated on the creative side while multiplying on the inventory side. You author fewer aspect ratios and manage more auction environments. Situating Meta correctly inside your wider mix matters here, and it helps to see it alongside the other performance channels available to mobile apps in 2026 rather than in isolation.
Feed and the core surfaces
Feed remains the anchor. Facebook and Instagram Feed carry the highest intent and the strongest click behaviour, because feed browsing includes active evaluation and clicking rather than passive scrolling. In placement benchmarks, Feed delivers the highest click-through rates, with Facebook Feed around 1.2% CTR against roughly 0.45% to 0.75% on the vertical surfaces. Feed is also the most expensive per thousand impressions. That trade is the whole story of 2026 placement strategy in miniature: you pay more for the surface where users decide.
The vertical 9:16 surfaces after the March 2026 unification
The March 2026 change unified Facebook Stories, Facebook Reels, Instagram Stories, and Instagram Reels into a single 9:16 safe zone. This is a creative-spec unification, not a collapse of reporting: you still see Reels, Stories, and each app separately in delivery data, but you now design one vertical asset against one shared safe area. Reels is the cheapest reach on the platform, running 15% to 25% lower CPMs than Feed, while Stories sits in the middle on cost and tends to over-index for retargeting because of its urgency-driven, full-screen format.
Explore, Search, Marketplace, and the Audience Network
These are the supporting placements. Explore, Search, and Marketplace extend reach into browsing and shopping contexts, and they are usually delivered through automated placement selection rather than targeted individually. The Audience Network, Meta's off-platform inventory across third-party apps and sites, is the most debated of the group. It can produce very cheap conversions for purchase-optimised campaigns, but traffic quality varies sharply by objective, and it is often poor for top-of-funnel or lead campaigns. We return to the exclude-or-keep question below, because it is where most teams make an avoidable mistake.
Threads, the newest inventory pool
Threads is the genuinely new surface for 2026. After a yearlong testing phase, Meta opened Threads ads to every user worldwide in January. For now it behaves like early Reels did: lower auction competition, cheaper impressions, and a format that rewards native, conversational creative over repurposed feed assets. Treat it as incremental inventory to test, not as a core surface to lean on. Its economics will normalise as demand catches up.
What to expect: cost versus conversion by placement
Across Meta ad placements in 2026, the pattern is consistent: the placements that are cheapest to reach are not the placements that convert best. Reels wins on CPM, Feed wins on click-through and conversion rate, and Stories sits between the two while punching above its weight on retargeting. Cost efficiency and conversion quality pull in opposite directions, and averaging them hides the signal.
Feed vs Stories vs Reels 2026 benchmark comparison
| Placement | Average CPM | Average CTR | Average conversion rate |
|---|---|---|---|
| Facebook Feed | $11.50 | 1.20% | 2.8% |
| Facebook Stories | $8.40 | 0.55% | 2.2% |
| Facebook Reels | $6.50 | 0.45% | 1.8% |
Source: https://benly.ai/learn/meta-ads/meta-ads-feed-vs-stories-vs-reels
The placement benchmarks bear this out. Facebook Reels runs the lowest CPM on the platform, near $6.50 on average, but also the lowest conversion rate, around 1.8%. Facebook Feed runs the highest CPM, above $11, yet holds the strongest conversion rate at roughly 2.8%. Instagram Stories lands in the middle on both. Read only the top of the funnel and Reels looks like the obvious allocation. Read to the bottom and the ranking inverts. This is exactly the dynamic that shows up when you compare Meta against other channels: the same asset and audience can price and convert very differently depending on where they land, which is why a channel-level view of Apple Search Ads versus Meta tends to reward whoever measures past the click.
For an operator, the takeaway is not "always run Feed." It is that any placement benchmark stated in CPM or CPI is only half a data point. The other half is what those users do after they install, and that half is where 2026 placement strategy is won or lost.
Why Meta ad placements in 2026 are a revenue-quality decision, not a cost decision
Meta ad placements in 2026 are a revenue-quality decision, not a cost decision, because the cheapest placements routinely win the install and lose the LTV. The clearest evidence we have for this is not a benchmark chart. It is a live account.
In one mobile-app account we managed, Facebook Reels generated 55.8% of installs at a $5.06 CPI, but accounted for only 7.5% of Meta-reported purchase-conversion value. Instagram Stories delivered just 2.5% of installs at a $10.73 CPI, yet accounted for 54.7% of purchase-conversion value. The placement that looked weakest on acquisition cost was the strongest on downstream value, by an order of magnitude.
Meta placement report: cheapest install placement, lowest downstream value
| Placement | CPI | Mobile app installs | Purchase-conversion value |
|---|---|---|---|
| Facebook Reels | $5.06 | 1,451 | $5.59 |
| Instagram Stories | $10.73 | 66 | $40.58 |
| Total | — | 2,602 | $74.16 |
Two disciplines matter when reading a table like this. First, the figure is Meta-reported purchase-conversion value, not literal revenue and not LTV. It is the platform's attributed value signal, which points directionally toward LTV without being the same thing. Second, the split is not universal; it reflects one account, one vertical, and one measurement window. But the shape of it, cheap installs concentrated on one surface and attributed value concentrated on another, is a pattern we see often enough that it should change how you allocate. If you had optimised this account toward the lowest CPI, you would have poured budget into the surface producing 7.5% of the value and starved the surface producing 54.7% of it.
This is the reframe. Placement is not a lever for buying installs more cheaply. It is a lever for buying better users, and "better" only shows up when you measure past the install.
How to win: evaluate placements on business outcomes, not CPI
The fix follows directly from the data. Evaluate placements on business outcomes: trial-to-paid conversion, purchase rate, ROAS, and LTV, not CPM or CPI in isolation. A placement that looks efficient on cost and thin on value is not efficient. It is expensive in the only currency that matters, which is the quality of the users it brings.
This is not a new idea inside Applica so much as a standing discipline: distinguish efficiency (cost-per-X) from volume (installs), and tie any upper-funnel movement to downstream value before calling it a win. Cheap volume that does not convert is a cost, not a result. Applying that lens to placements means building your reporting so that every surface carries a value column next to its cost column, and judging the surface on both.
The catch is measurement lag. Trial-to-paid and renewal signals arrive days or weeks after the install, well after CPI is visible, which tempts teams to judge placements on the fast metric and kill the slow winners before their value lands. The same lag problem shows up in paywall testing, where the same paywall can win on organic and lose on Meta precisely because the source shapes the downstream behaviour. Placements behave the same way. Build the patience, and the instrumentation, to wait for the value signal before you reallocate.
The value pattern also shifts by vertical. A FinTech app's most valuable users may cluster on a different surface than a WellTech or EdTech app's, because the intent, the price point, and the conversion moment differ. Do not import another category's placement allocation as a starting assumption. Read your own account.
Should you exclude Audience Network?
Usually, no. The Audience Network can look like inefficient spend when judged on surface-level quality metrics, but excluding it outright shrinks the inventory Meta can buy from, increases auction pressure on the placements that remain, and often raises blended CPI rather than lowering it. Meta's own guidance leans hard against manual exclusions, because Advantage+ placements generally deliver a lower cost per result when the algorithm has the full surface area to explore. Meta has also steadily removed manual controls since 2024 and now spends a small share of budget on excluded placements by default on some objectives, a signal of how much it wants delivery kept open.
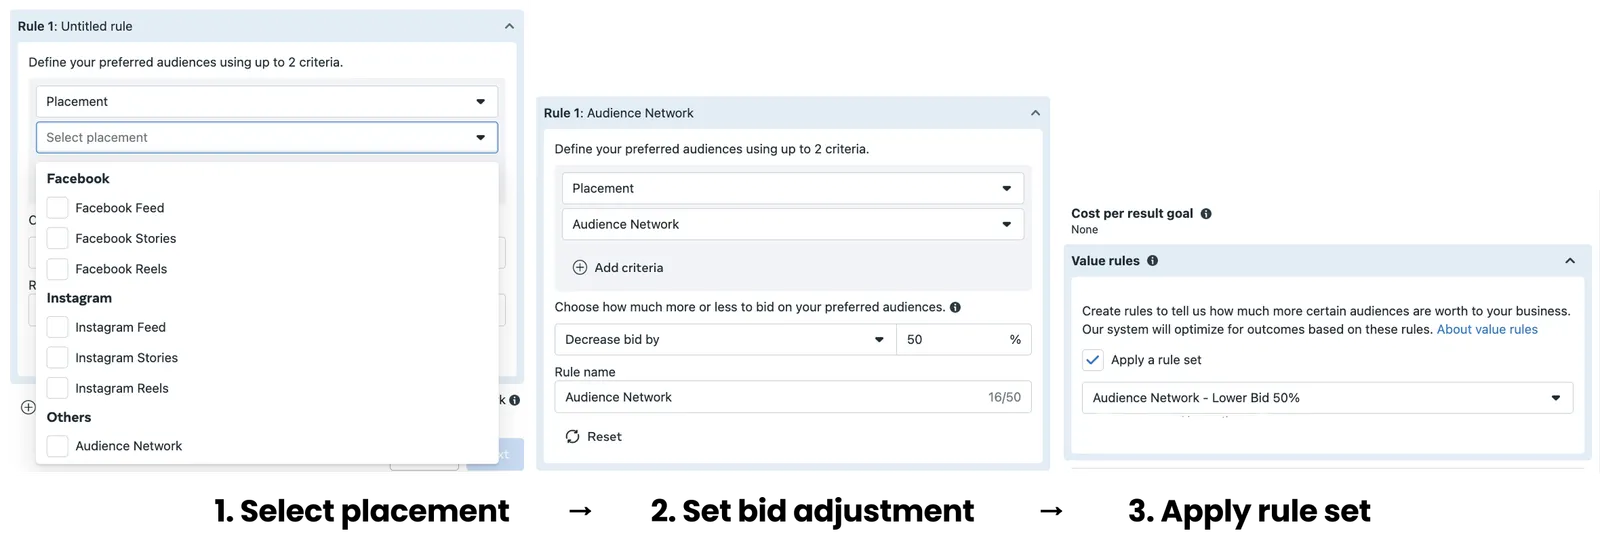
The mistake is treating exclusion as the only tool. It is the bluntest one. Before you cut a placement, you can tell Meta which inventory brings your best users and let it bid accordingly. That is what value rules do, and in 2026 they support placement-specific criteria, so you can assign more value to Feed conversions and less to weaker surfaces without removing anything from the auction. Meta rolled out value rules for placements precisely so advertisers could steer allocation with a scalpel instead of a hatchet, applying bid multipliers across dimensions like placement, device, and geography rather than hard-excluding.
Value rules are one of the most underused levers in Meta advertising. Instead of shrinking your audience by excluding placements, use value rules to signal which inventory brings the most valuable users and bid more aggressively for it. When applied correctly, they can improve overall performance while preserving Meta's ability to find efficient reach.
© Diana Daniuk, User Acquisition Manager at Applica
Value rules are not free of risk. Set them too aggressively and they can cost more than they save by over-bidding on a segment that was never as valuable as the multiplier assumed. The discipline is the same as everywhere else in this piece: base the value you assign on measured downstream outcomes, not on a hunch about which surface feels premium. A value rule is a hypothesis with a bid attached, so it deserves the same validation any other test would get.
Adapt creative to the placement, not the placement to the creative
Creative adaptation is not optional placement hygiene in 2026; it is one of the highest-leverage moves available. Teams routinely upload a single 4:5 asset across Feed, Stories, and Reels, which leaves empty or auto-filled space on the vertical surfaces and weakens the ad's ability to command the screen. The strongest setup is usually two versions, a 4:5 for Feed and a 9:16 for the vertical surfaces, each designed around the placement's safe zones.
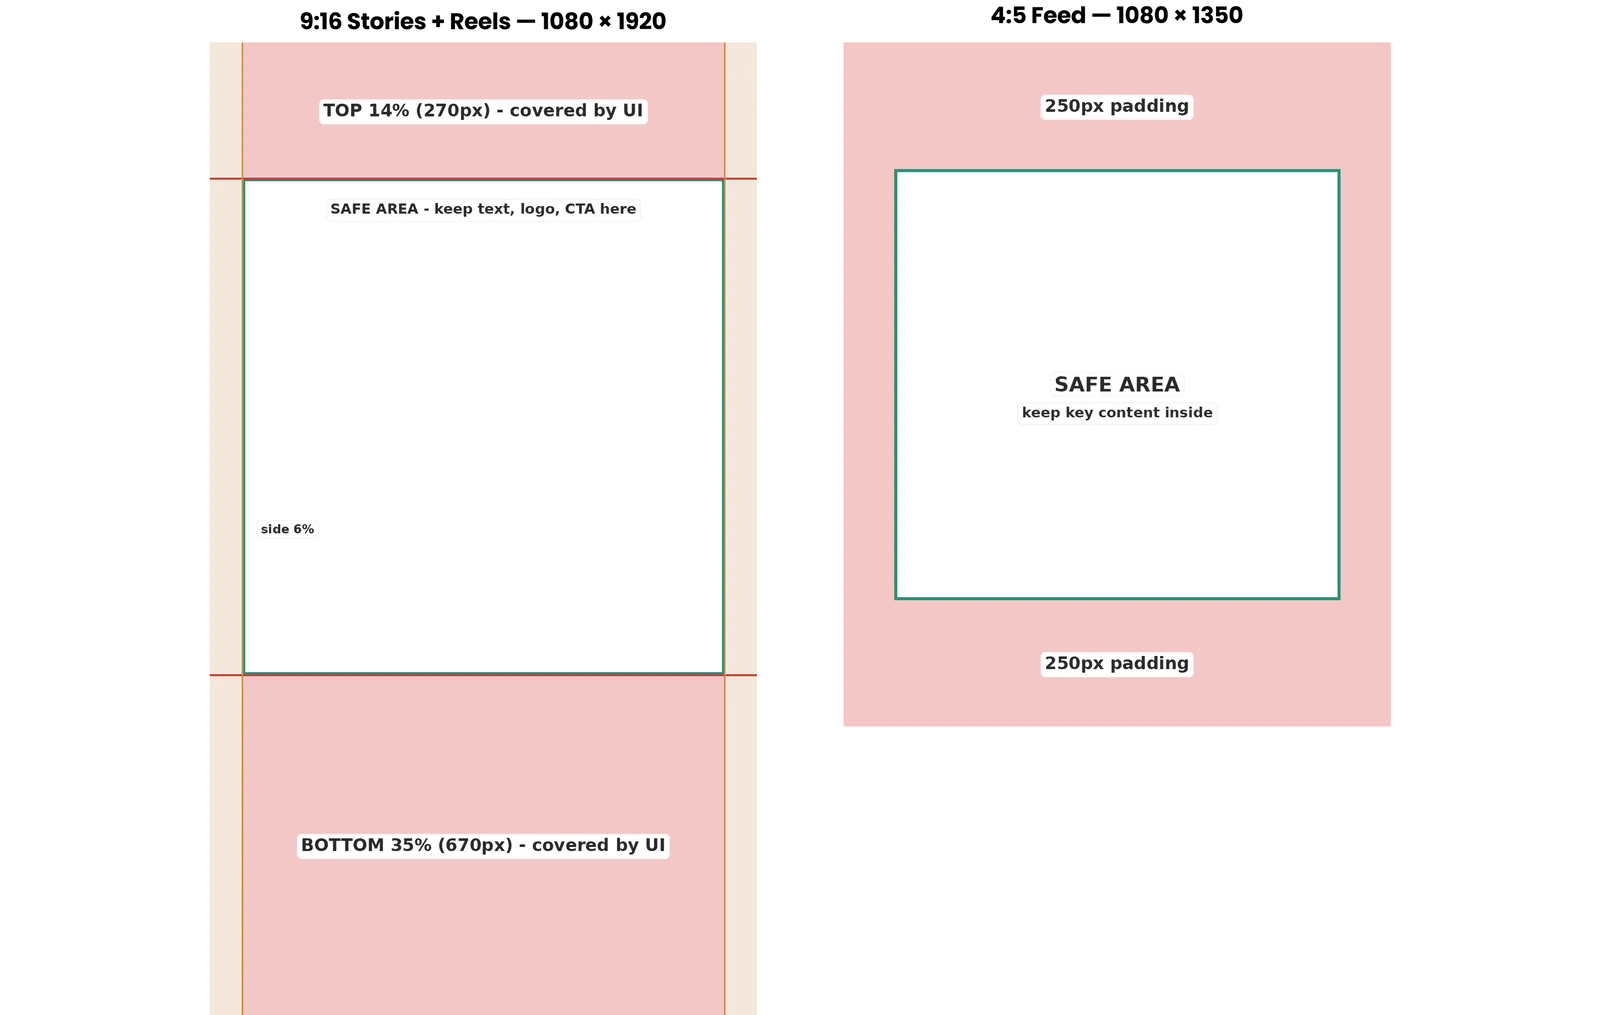
The March 2026 safe-zone unification makes this easier and more important at once. With a single 9:16 safe zone across the vertical surfaces, one well-built vertical asset now serves Stories and Reels on both apps, and production teams have already changed what they stop and start doing to keep copy and key visuals inside the shared safe area. A universal asset can still work, but only if the important elements sit inside the intersection of every placement's safe zone; otherwise the vertical surfaces crop or overlay exactly the part you needed the user to see.
This matters more than most placement decisions because creative increasingly determines who an ad reaches. As Meta's algorithm leans on the creative itself to match ads to people, a format-appropriate asset is not just cleaner; it changes delivery. Building distinct, safe-zone-aware assets per surface is a creative production discipline, not an afterthought, and it compounds with everything else in this guide: the right creative on the right surface, evaluated on the right metric.
Test before you restrict, and treat Threads as incremental
Do not split or exclude placements unless a test proves the change improves business outcomes. Placement restrictions shrink available inventory, raise auction pressure, and frequently increase CPM and CPI as a result. Worse, adding or removing placements counts as a significant edit that can reset the learning phase, pushing the campaign back into a costlier, higher-variance state. In most accounts, placement optimisation is a marginal lever applied with discipline, not a breakthrough growth strategy.
The auction-pressure logic is the same one that governs learning-phase resets more broadly. Anything that forces Meta to relearn delivery raises the cost of that period, which is why even a pricing change can reset your Meta learning phase and set performance back before it recovers. Restructuring placements carries the same tax. The default should be to keep placements consolidated, tolerate a small amount of inefficient-looking spend, and reach for value rules before you reach for exclusions. When you do want to restrict, prove it first with a controlled test, so the decision rests on downstream outcomes rather than on how a surface looks in a CPM column.
Threads deserves the opposite instinct, within reason. New inventory is worth adopting early, especially when you adapt the creative to the format, because early advertisers can benefit from lower auction competition before demand catches up. But treat Threads as incremental inventory that adds reach, not as a replacement for Feed, Stories, and Reels, which still provide the core scale. Test in, measure on business outcomes like everything else, and size it to the value it actually returns.
The 2026 placement decision, in three rules
The full map is worth knowing, but the operating logic reduces to something you can act on Monday. Evaluate every placement on business outcomes, trial-to-paid, purchase rate, ROAS, and LTV, not on CPI. Consolidate by default, and use value rules to steer allocation before you exclude anything. Test before you restrict, because splitting placements shrinks inventory, raises auction pressure, and resets learning far more often than it unlocks efficiency.
Underneath all three sits the same idea: Meta ad placements in 2026 are a revenue-quality decision, not a cost decision, because the cheapest placements routinely win the install and lose the LTV. The teams that win in 2026 are not the ones chasing the lowest CPI across a reshaped inventory. They are the ones measuring which surfaces bring the users worth keeping, and allocating toward value even when the cost column argues otherwise.
If your account has not been evaluated on downstream value by placement in the last quarter, that is where the leak usually is. Explore where your Meta placements are leaking value with a performance marketing audit, and turn the cheapest-install reflex into a best-user strategy.